Aviation Safety Analysis
Can we improve Aviation Safety by studying accident data from the past?
Air travel is getting affordable day by day and in effect people are using air transport more commonly. There have been cases of incidents/accidents which bore similarity to past accidents. This got me thinking as to how can we avoid future accidents by studying data from the past. i.e. Can we get insights form past data to work towards a better future.
In my Capstone project at General Assembly, I used Data Science techniques such as Natural Language processing and Clustering to find patterns in the past aviation incidents/accidents. Aviation Accidents have fatalities involved in the event, whereas Incidents are events which did not involve any fatalities. I will be studying both types of events together, since the cause for a near miss event could be a potential cause for the next accident.
Project Outline
- Problem Statement
- Getting the data
- Data Cleaning and preprocessing
- Data Visualization
- Modelling & Results
Problem statement
The aviation safety authority is the body in a country that licenses pilots, registers the aircrafts and oversees the overall safety. Safety management systems help organisations identify safety risks before they become bigger problems. Civil Aviation Requirements require the aviation industry to put safety management systems in place as an extra layer of protection to help save lives.
Most people believe that aviation accidnets are individual incidents. On an average there are 200 events(accidents+incidents) that occur every year across the world. It may seem like a small number compared to road accidents, but considering the technology and the money involved in this industry, it is a large number.
Getting the data
Considering the number and frequency of the events occuring in a year, it made sense to collect as much as data that is possible. Since these are important records for aviation industry, plane crash databases from early 19th century till 2017 were recorded in these websites.
- http://www.planecrashinfo.com/database.htm
- https://aviation-safety.net/database/
Challenge: The database was neither in an easily downloadable csv format nor in an SQL database. In order to start my analysis the first challenge was to get the website data into a csv or an SQL database.
Solution: Data scrapping techniques were used to extract data from websites and save as usable format. I wrote a python program to create a Crawl bot. Spyder from Scrapy python package was used.
Data Cleaning and Preprocessing
- Initial dataset consisted of 8184 events recorded with 38 features.
- There were missing values in several feature and it was not consistent across one data point. Since most of the events were unique on their own, I did not delete it unless 80% of the features had missing values.
- Cleaning the Location information consumed time since the textual information was not directly understandable by Google maps API.
- Feature Engineering: Geospatial coordinates were required, hence the cleaned Location information was passed to Google maps APIs to request for the coordinates. From the year and month information, Seasons and Hemispheres were feature engineered.
Data Visualization
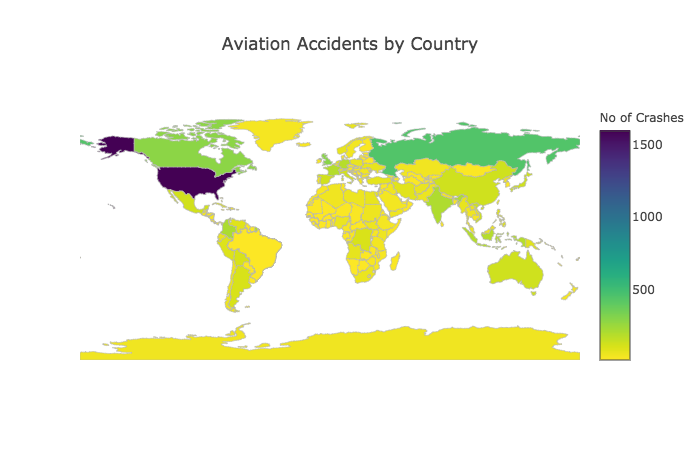
Heatmap of Countries
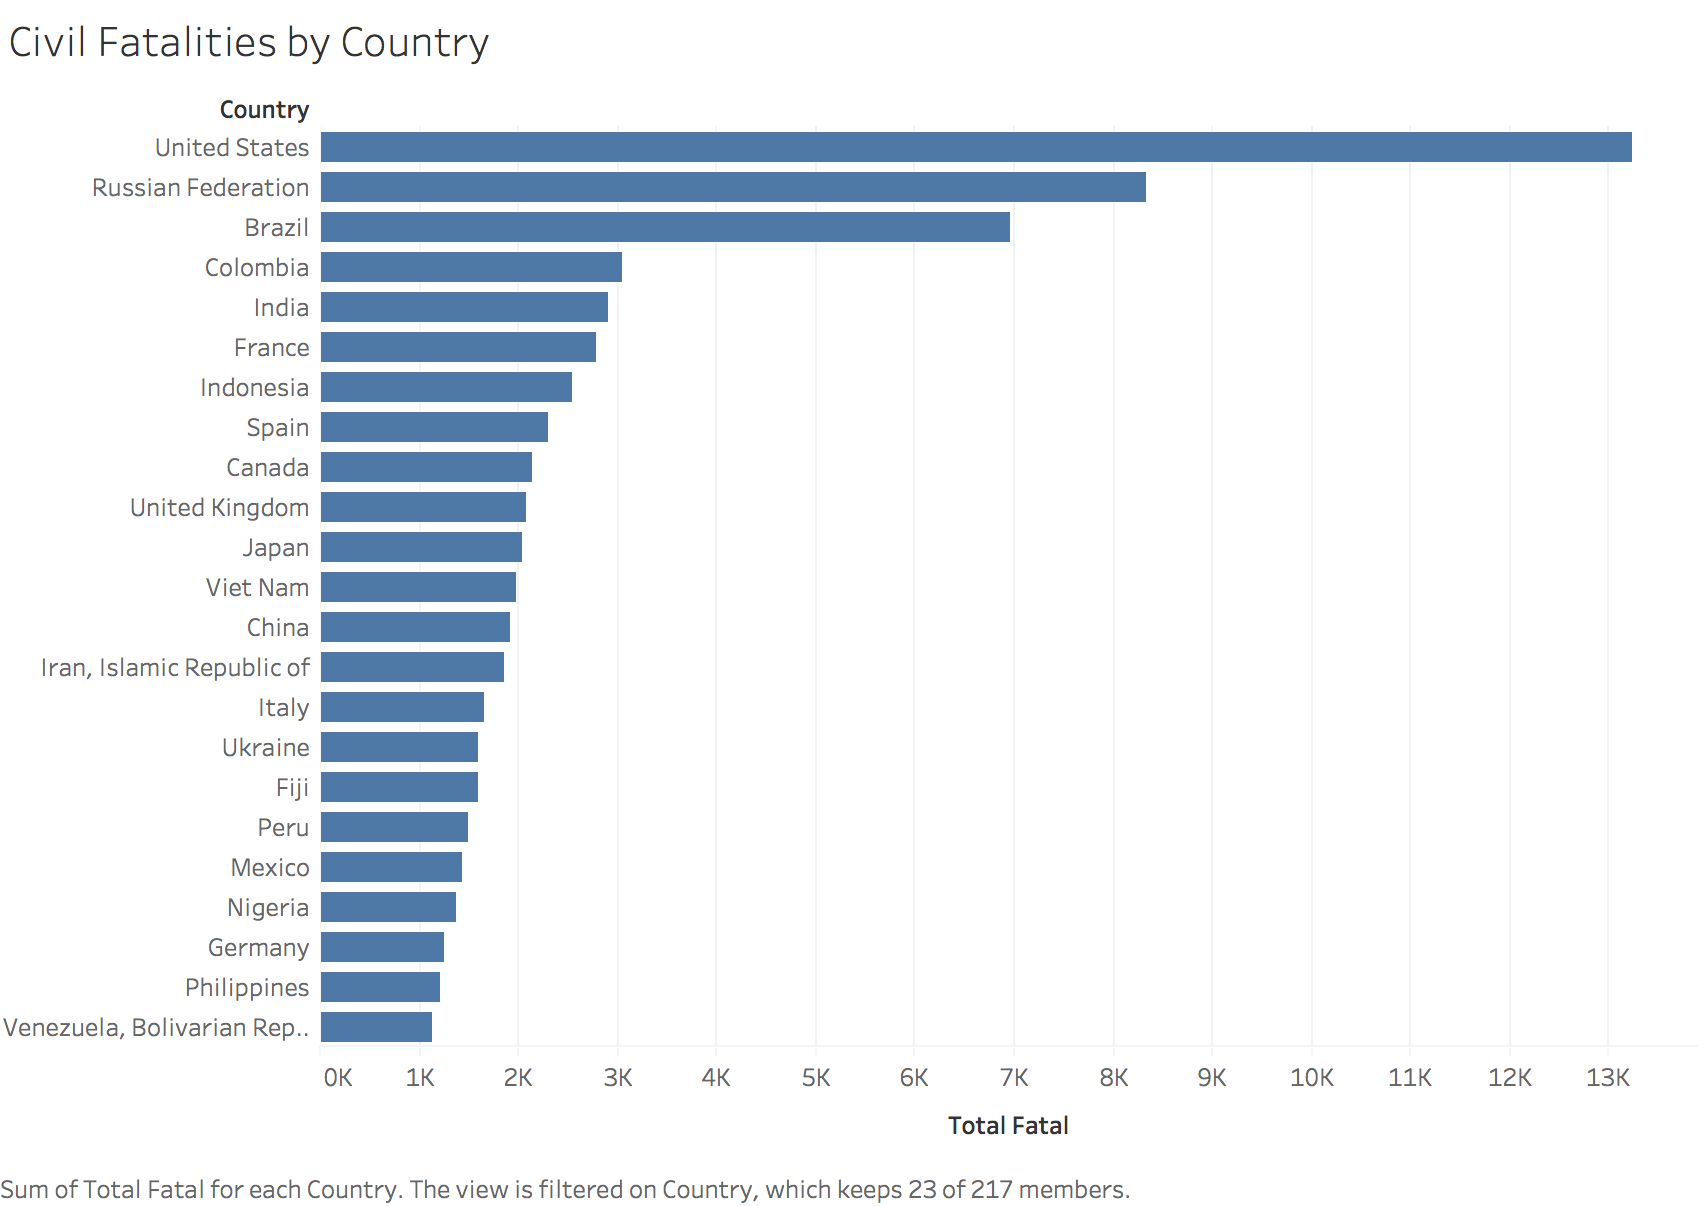
Countries with maximum number of Civil Fatalities
- This graph is purely on the numbers. It could also be that these countries could be flying more hence the number is more. If a dataset with the total number of people travelling in a country per year, the fatality percentage would be a better view.
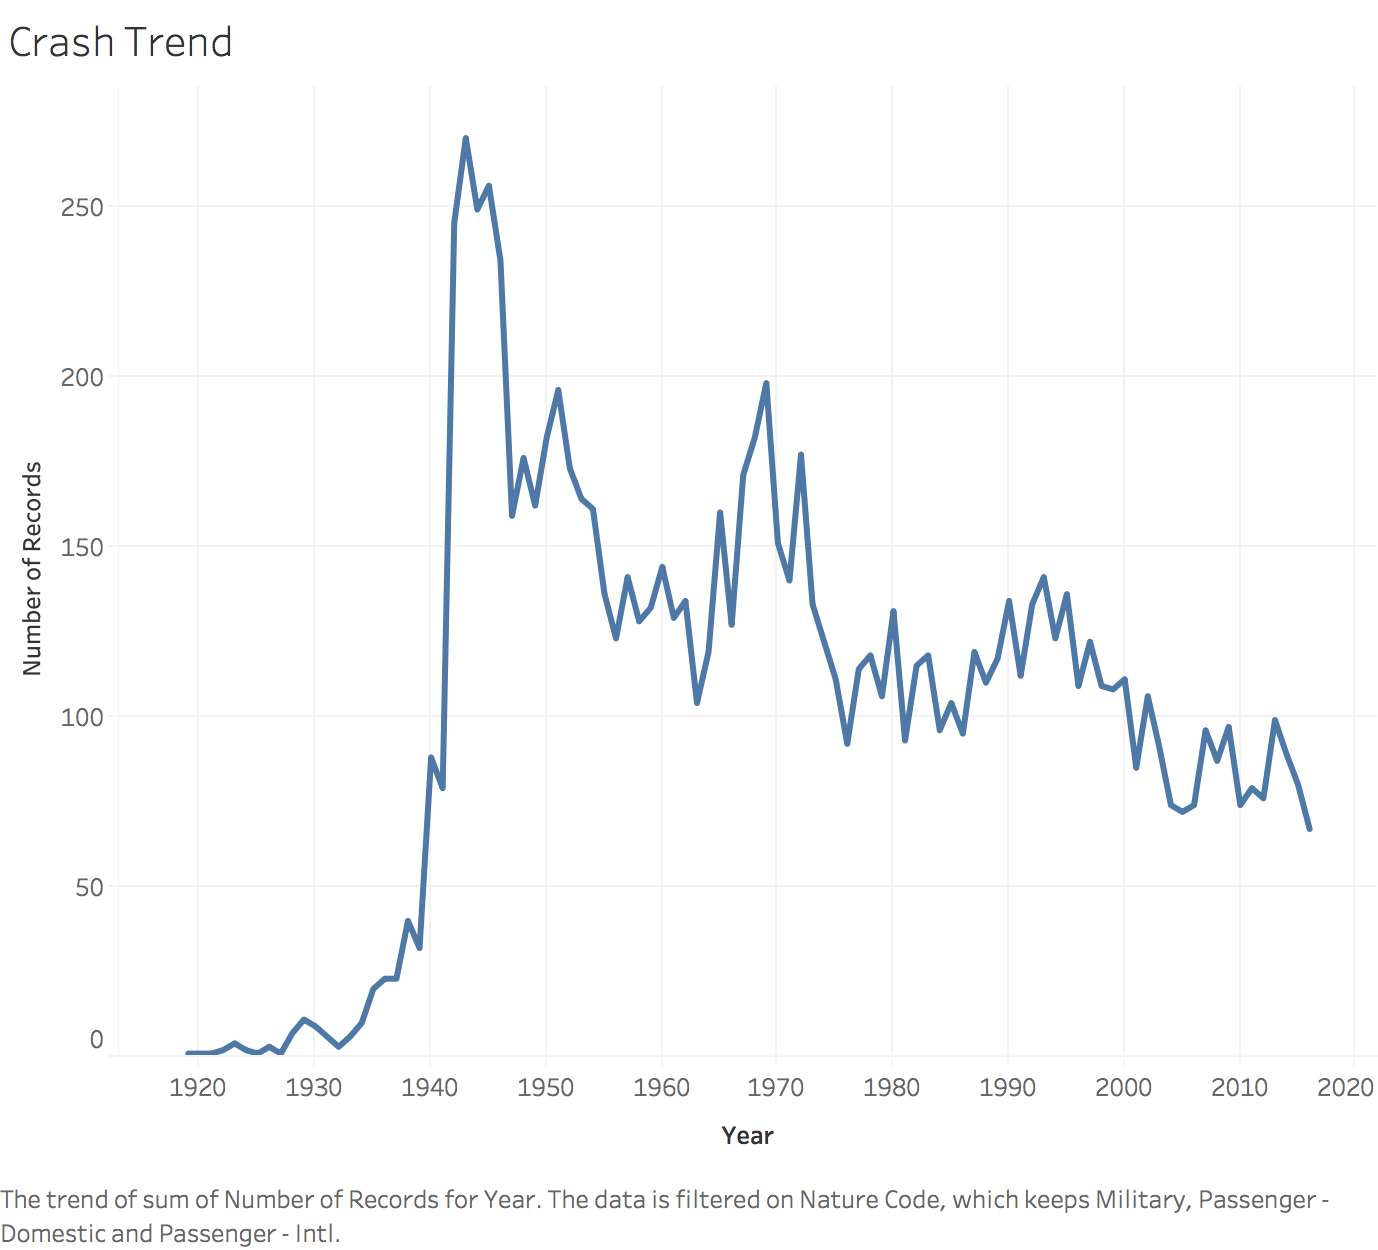
Accident and Fatality Trend over the decades
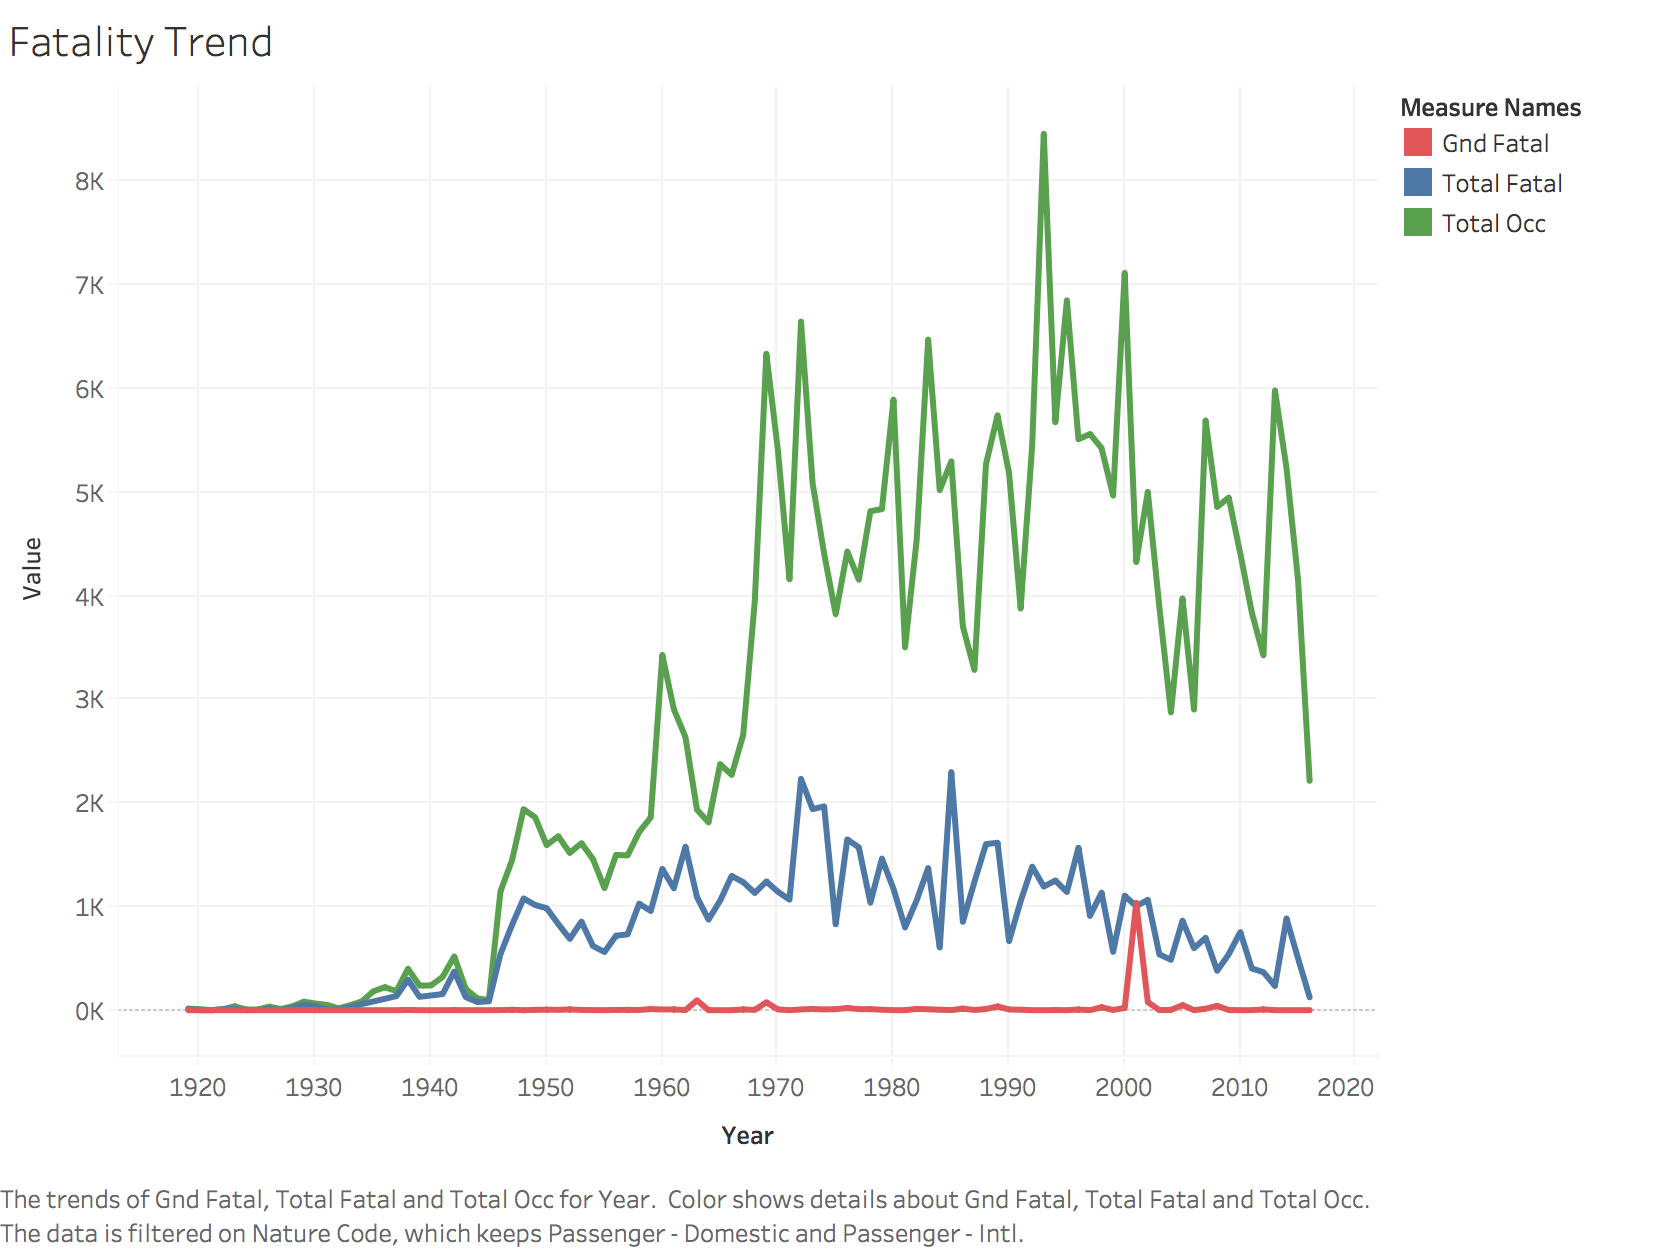
As anyone would be, I was curious to see the accident trends based on the data. The trend is definitely declining. But its interesting to see the peaks during 1940s and 1970s and 1990s.
- The world war 2 explains 1940s.
- 1970s had it all - hijackings, crashes and military deployments in Vietnam. That was also when airfares got cheaper, Boeing capacity increased from 100 to 300 and hence more people travelled.
Around 1990s there was an increase in new airlines and aircrafts like Australia Asia airlines, Air Japan. Boeing capacity increased from 300 to 500 and was capable of longer flights. It was estimated that the number of international trips made by Australians increased by 75 percent.
Over all the accident trend is declining except during wars or innovations!
The chance of dying in an airplane crash is less than while riding a bicycle. But constant improvement is required as air travel is becoming a common mode of transport. The aviation safety is definitely getting better over the years. The trend shows that number of lives lost is lesser than before. It is good, but we definitely need better!
If you are interested to checkout my Tableau dashboard, Click here
Modelling & Results
After understanding the dataset, the following questions needed to be answered to look for patterns.
- What have been the major causes of accidents?
- Weather, Human error, technical faults, airtraffic managment are some of the commonly heard causes in an accident. I am interested to know the major contributor to the cause of accidents.
Challenge:
The causes are not directly available in the dataset. The dataset contains unstructured textual content that describes the cause of the accident.
Method 1:
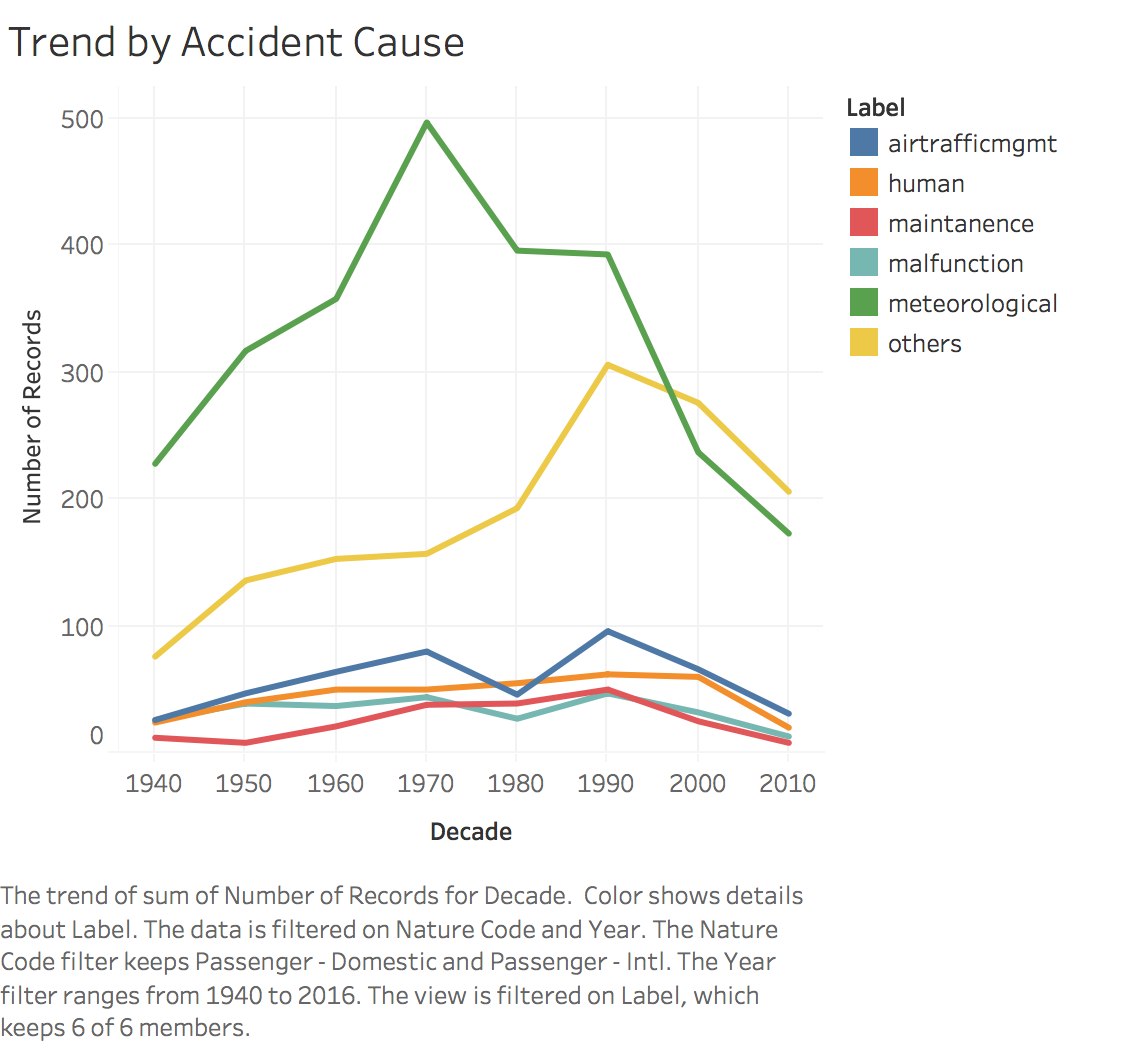
- Use NLTK libraries to train a model that categorizes the reason of each accident based on unstructured text.
- Preprocess text, Tokenize using Vectorizer, Transformer and SVM Classifier. SVM is regarded as on of the best text classification algorithm.
Results of Classification:
Method 2:
- Unsupervised Topic Modelling using LDA - Cleaning, Preprocessing text, Preparing document term matrix, LDA model
Result of Topic Modeliing:
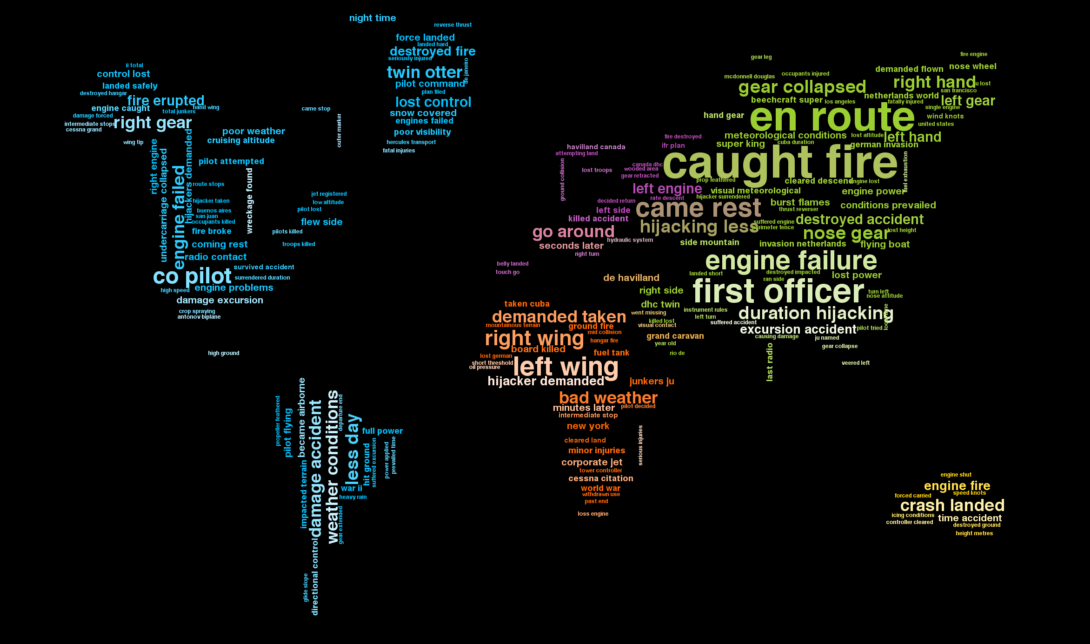
Quite Interesting! After trying several number of topics, 3 topics gave distinct categories that were similar to Engine Failures, Pilot errors, Hijackers.
- Weather, Human error, technical faults, airtraffic managment are some of the commonly heard causes in an accident. I am interested to know the major contributor to the cause of accidents.
- Is there an area that has had a high density of crashes in the past?
- It is important to know the root cause of an area being susceptible to accidents. Only with proper analysis, measures can be taken to avoid future accidents.
- It was not easy to look for high density areas on a map to start investigation.
- Clustering methods were required to find high density areas.
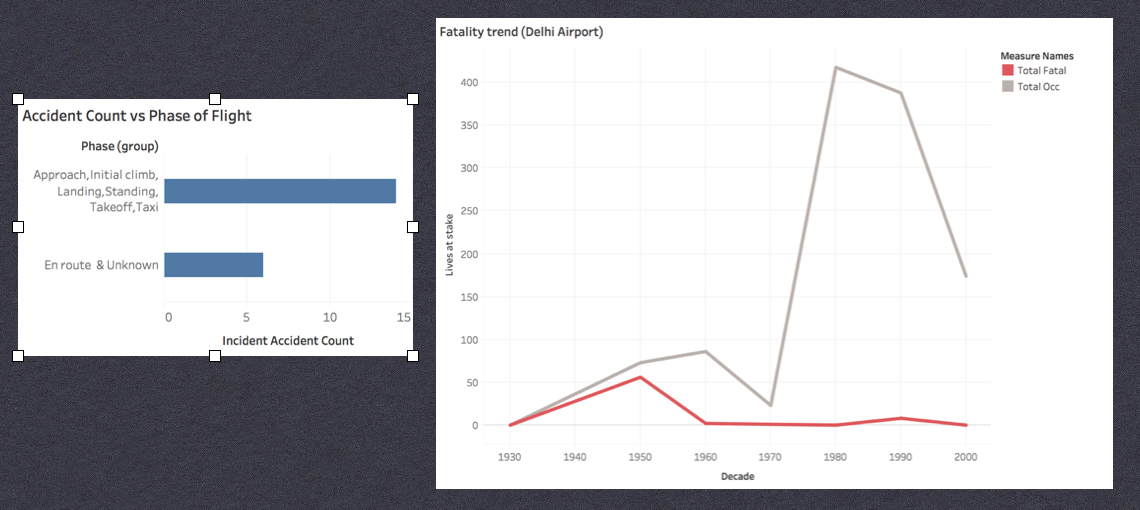
- DBScan clustering with haversine distance was found to be the most suitable algorithm. I set the parameters to find a location in Asia with at least 20 accidents that occurred within 1km from each other. From the results obtained I decided to delve into a familiar location.
- The insights were pretty interesting. More incidents were on the runway. It mostly pointed to Air traffic management issues.
- I was able find more articles that supported the claim.
- One good thing is these are incidents till now. The fatality trend below is quite good.
Conclusion
Due to project time constraints, we have been able to boil down on one location. But there are a lot more around the world.
With the large amount of data, it can over-whelming to know where to start looking. This model can be used to narrow down on potential risk locations.
As an enhancement to the model, more datasets relating to weather information, airport staffing, last maintenance information could be collected, to find more insights and apply different models.