Executive Summary
Submitted by Roshan Lulu

Table of Contents
- Introduction
- Data Sources
- Data Scrapping
- Exploratory Data Analysis
- Feature Engineering
- Map Visualization
- Data Insights/Tableau
- Classifying common causes of plane crashes - NLP
- Locations with high density of crashes - Clustering
- Results interpretation and Recommendation
- Future steps
1. Introduction
In my capstone project I will be analysing the various aviation accidents that have occurred over the past few decades. Various data-science techniques such as data scrapping, data munging, machine learning, nlp will be employed thoughout this project.
Time and again we have heard disheartening stories of flight crashes around the world, particularly with increased frequency in the recent years. Flights are now very affordable and a common mode of transportation. It is of interest to analyse the accidents.
Some of the questions that I plan to answer during the course of this project are listed below:
- What have been the major causes of accidents?
- Weather, Human error, technical faults, airtraffic managment are some of the commonly heard causes in an accident. I am interested to know the major contributor to the cause of accidents. I will be using text analytics to create a classification for the causes.
- Is there an area that has had a high density of crashes in the past?
- It is important to know the root cause of an area being susceptible to accidents. Only with proper analysis, measures can be taken to avoid future accidents. Clustering techniques will be employed to find areas of high density crashes.
Targeted Audience
The target audience for this project are the Aviation Safety Authorities of all the countries. Due to the inherent dangers in the use of flight vehicles, National Aviation Authorities typically regulate the following critical aspects of aircraft airworthiness and their operation:
- Design of aircraft, engines, airborne equipment and ground-based equipment affecting flight safety
- Conditions of manufacture and test of aircraft and equipment
- Maintenance of aircraft and equipment
- Operation of aircraft and equipment
- Licensing of pilots and maintenance engineers
- Licensing of airports and navigational aids
- Standards for air traffic control In some countries the national aviation authorities build and operate airports, including non-airside operations such as passenger terminals
NOTE: This part of my capstone is to explain my project. Each part of this data science project has been done in parts and I will be providing links when each part is explained. These links can be used to go through the code int he notebook. However, I will try to include certain important code segments.
2. Data Source

Source: Plane crash databases from early 19th century till 2017 have been recorded in these websites.
- http://www.planecrashinfo.com/database.htm
- https://aviation-safety.net/database/
Challenge: The database is not in an easily downloadable csv format or in an SQL database. In order to start my analysis the first challenge was to get the website data into a csv or an SQL database.
Solution: Data scrapping techniques were used to extract data from websites and save as usable format.
3. Data Scrapping - Scrapy

Scrapy is a method to extract data from webpages. In my datasource, each data point was present in a different webpage. It is almost an impossible task to go provide the links of all webpages to scrape the data. This is a typical use case when a bot is required. I developed a scrapy bot that would extract the scrapped data across all the data points to a csv file.
**Detailed explanation of how I created the scrapy bot on my blog: **
- https://roshanlulu.github.io/data/science,/scrapy/2017/04/27/crawl-and-scrape.html
Scrapy bot framework and code can be found in this path in the project
- (../scrapybot/crawlbot/crawlbot/spiders/)
- NOTE: A link to the path canno be provided since it is a folder. To get an idea of my scrapping code, the spider code is provided below.
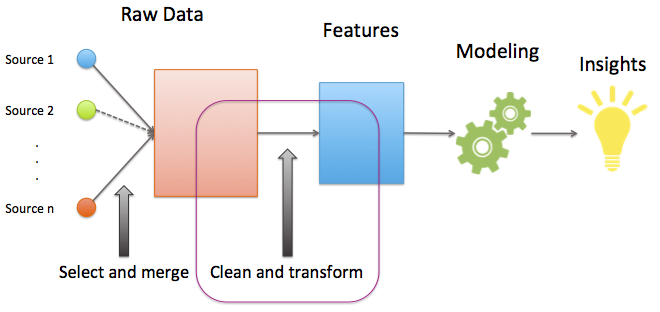
4. Exploratory Data Analysis

The detailed Exploratory data analysis with the entire code can be found in my github repository.
Categorizing the features during Data munging was helpful to decide the useful features for the project. The features I have retained, extracted or dropped have been described below.
5. Feature Engineering
Feature engineering - Latitude and Longitude
Latitude Longitude Extraction
- From the features above we get features required from the dataset. The Insights from this data is very very interesting. In order to analyse density of aircrashes in an area, I would require the latitude and longitude information of the locations. I
- The Google Geocode Api was used to extract Latitude Longitudes from the Locations.
Steps
- Get a API key from Google geocoder website: https://developers.google.com/maps/documentation/geocoding/intro
- This key is provided by google to allow developers to push 2500 requests to google apis in 24 hours.
- Provide a location, google returns the geospatial coordications a.k.a the latitude longitude of the location
- Provide a geospatial coordinate google will api will return the location and country details.
- This information was very crucial to proceed with my project
- Provide the location details to the api and save the details into an sql database and csv file.
- The country names and location names provide din the database were very messy. It required loads of cleaning to get the data into usable format.
- Regular expressions were very useful for the text cleaning purpose.
- Note: It is not advisable to push request using google api s when the information is already available.
Feature Engineering - Continent
- Along the project I realized, the data has a lot of segregations when we consider country, airline, aircraft.
- In order to categorize well, I decided to feature engineer the continents and the weather information into my dataset. The
pycountry_convertused to convert Country name to Country code. The continent was obtained from the country code
Feature Engineering - Weather and Hemisphere
- The weather during which the accidents occured was a good feature to explore. Since it was not present in the database I created a feature based on the continents and the month of the accident.
- Hemispheres were identified with the continet information and saved as a new feature
- Weather was identified based on the Month and the Hemisphere and added as a new feature for analysis
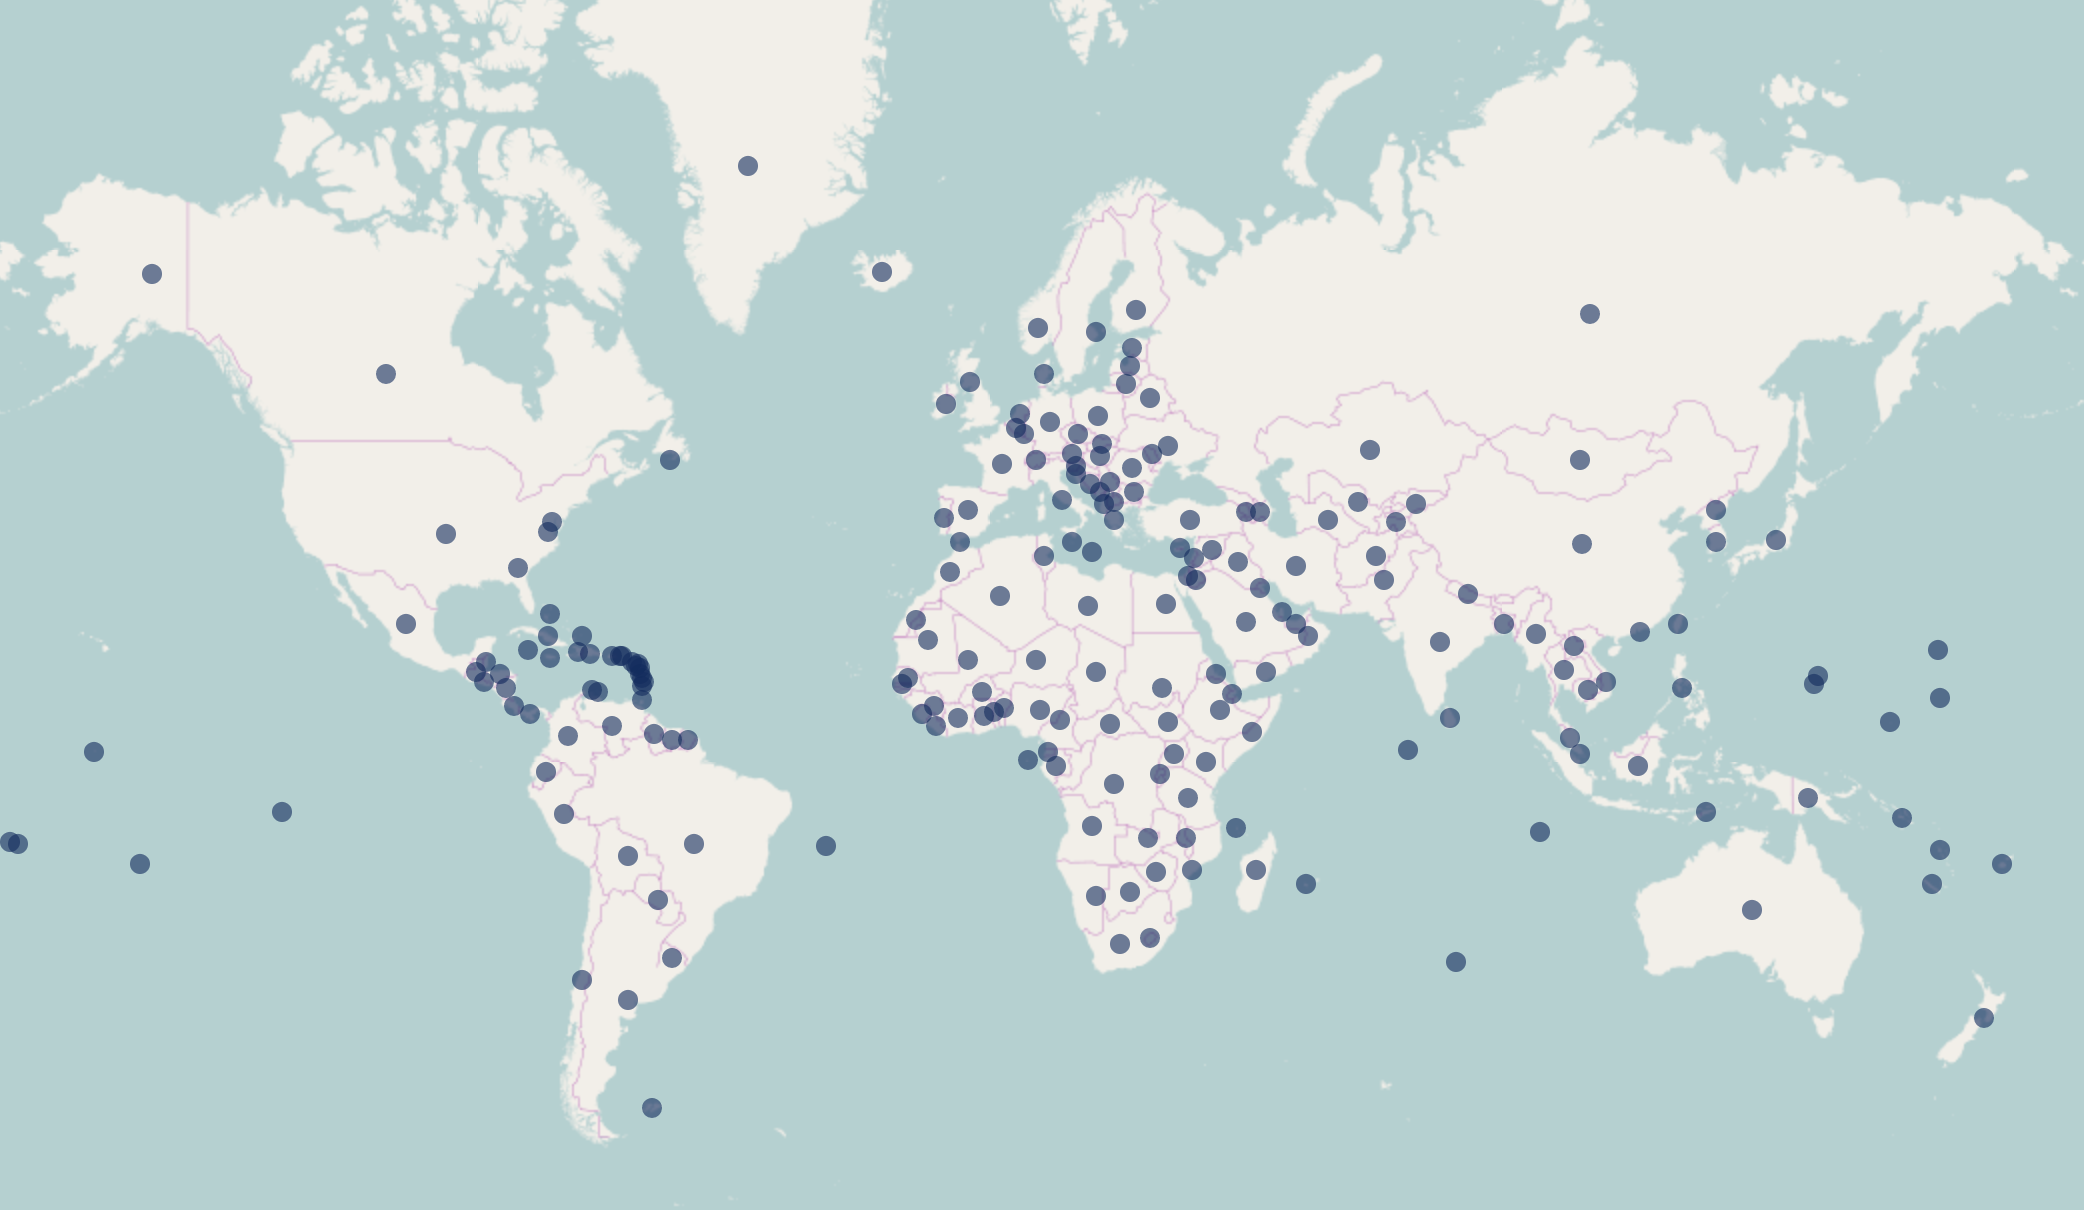
6. Map Visualization
The cleaned data points were plotted on the world map to get an idea of the locations with crashes.
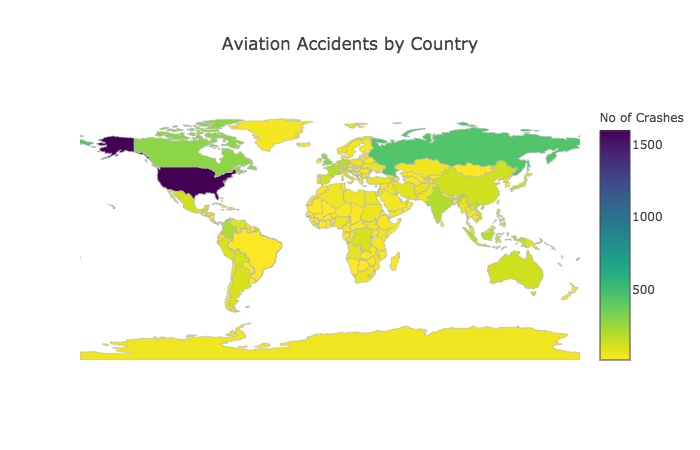
Countries affected
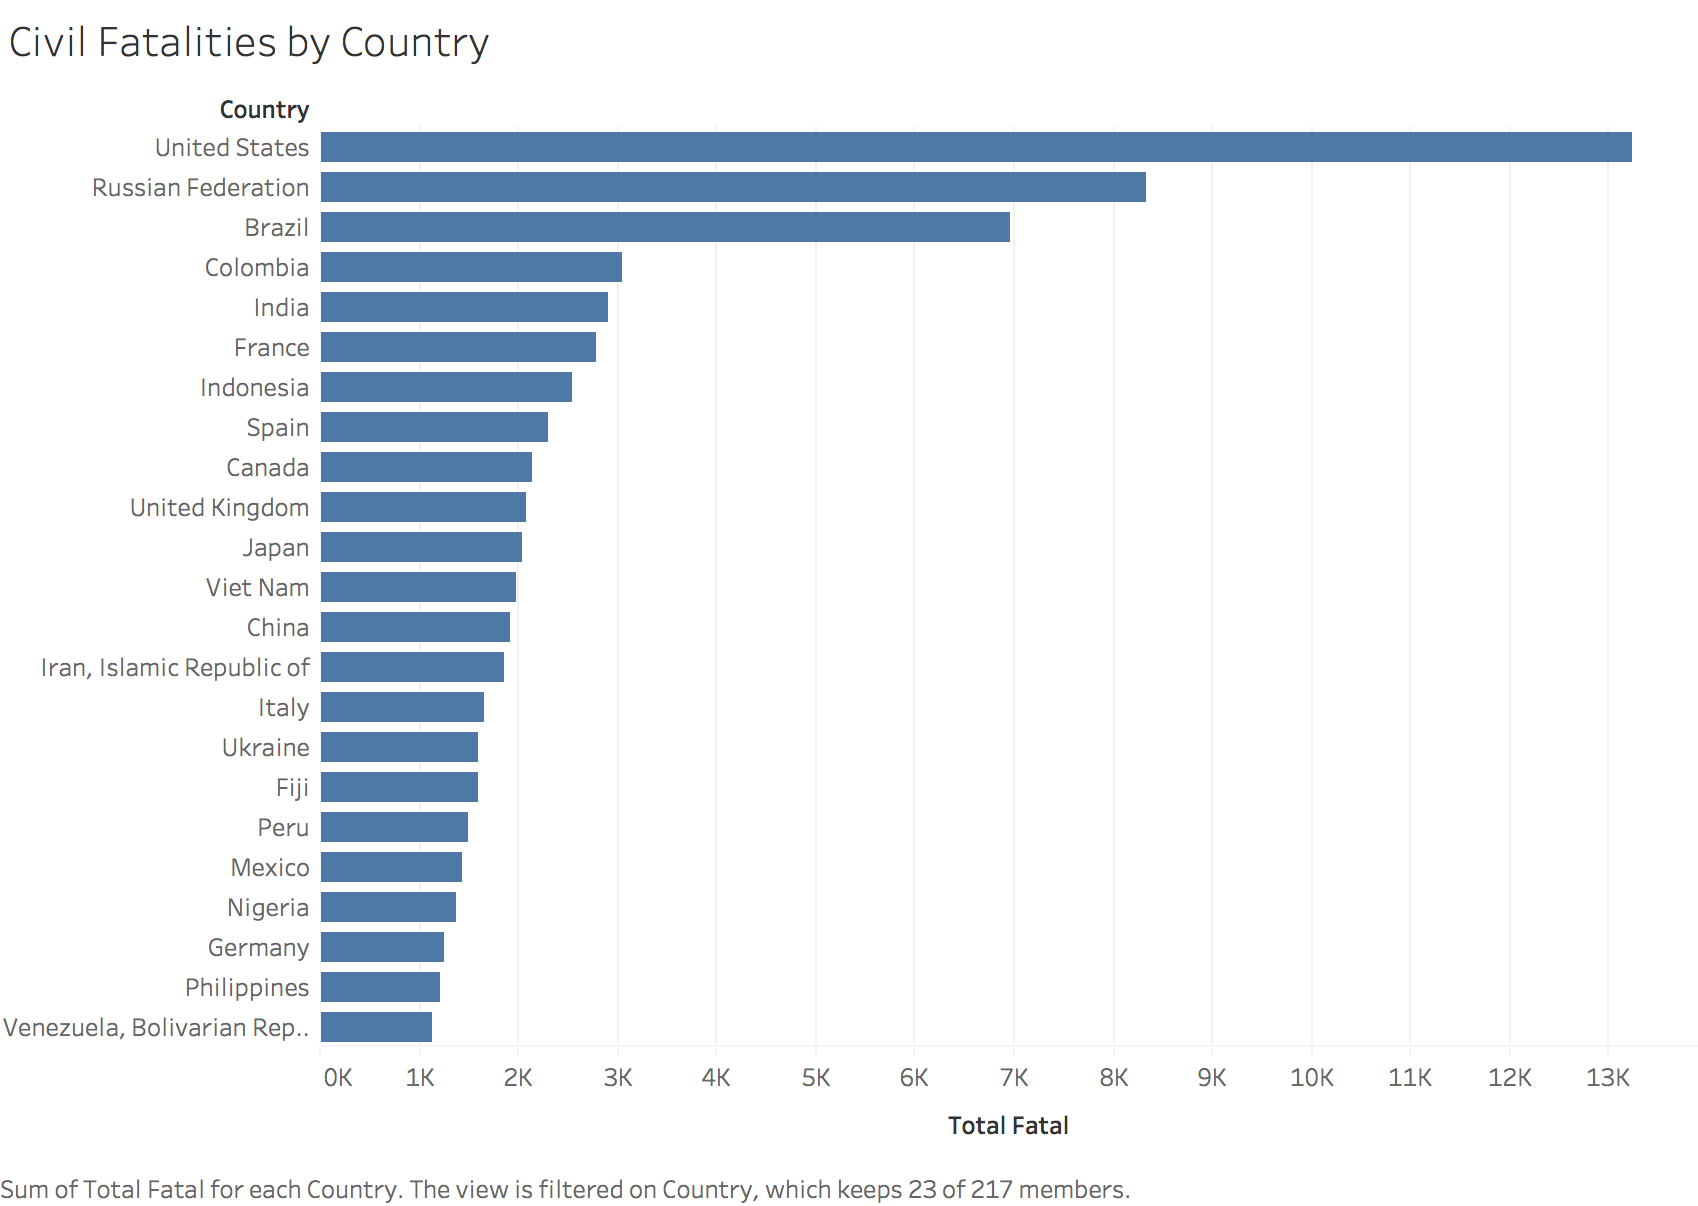
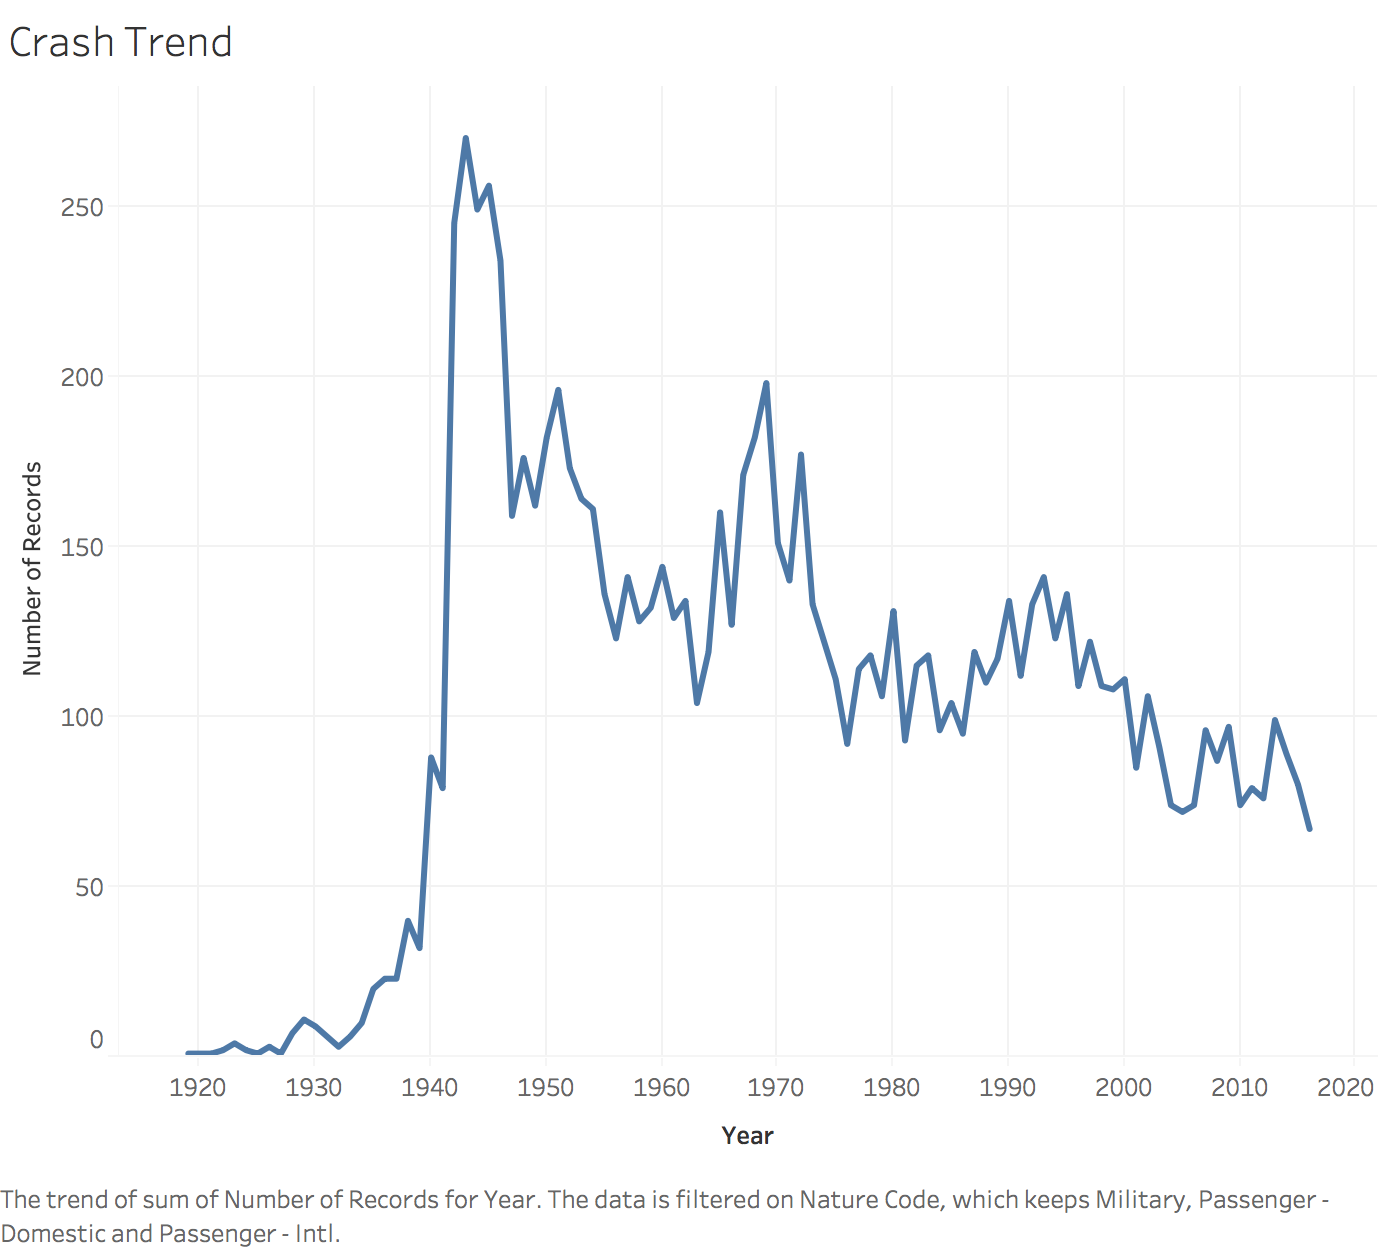
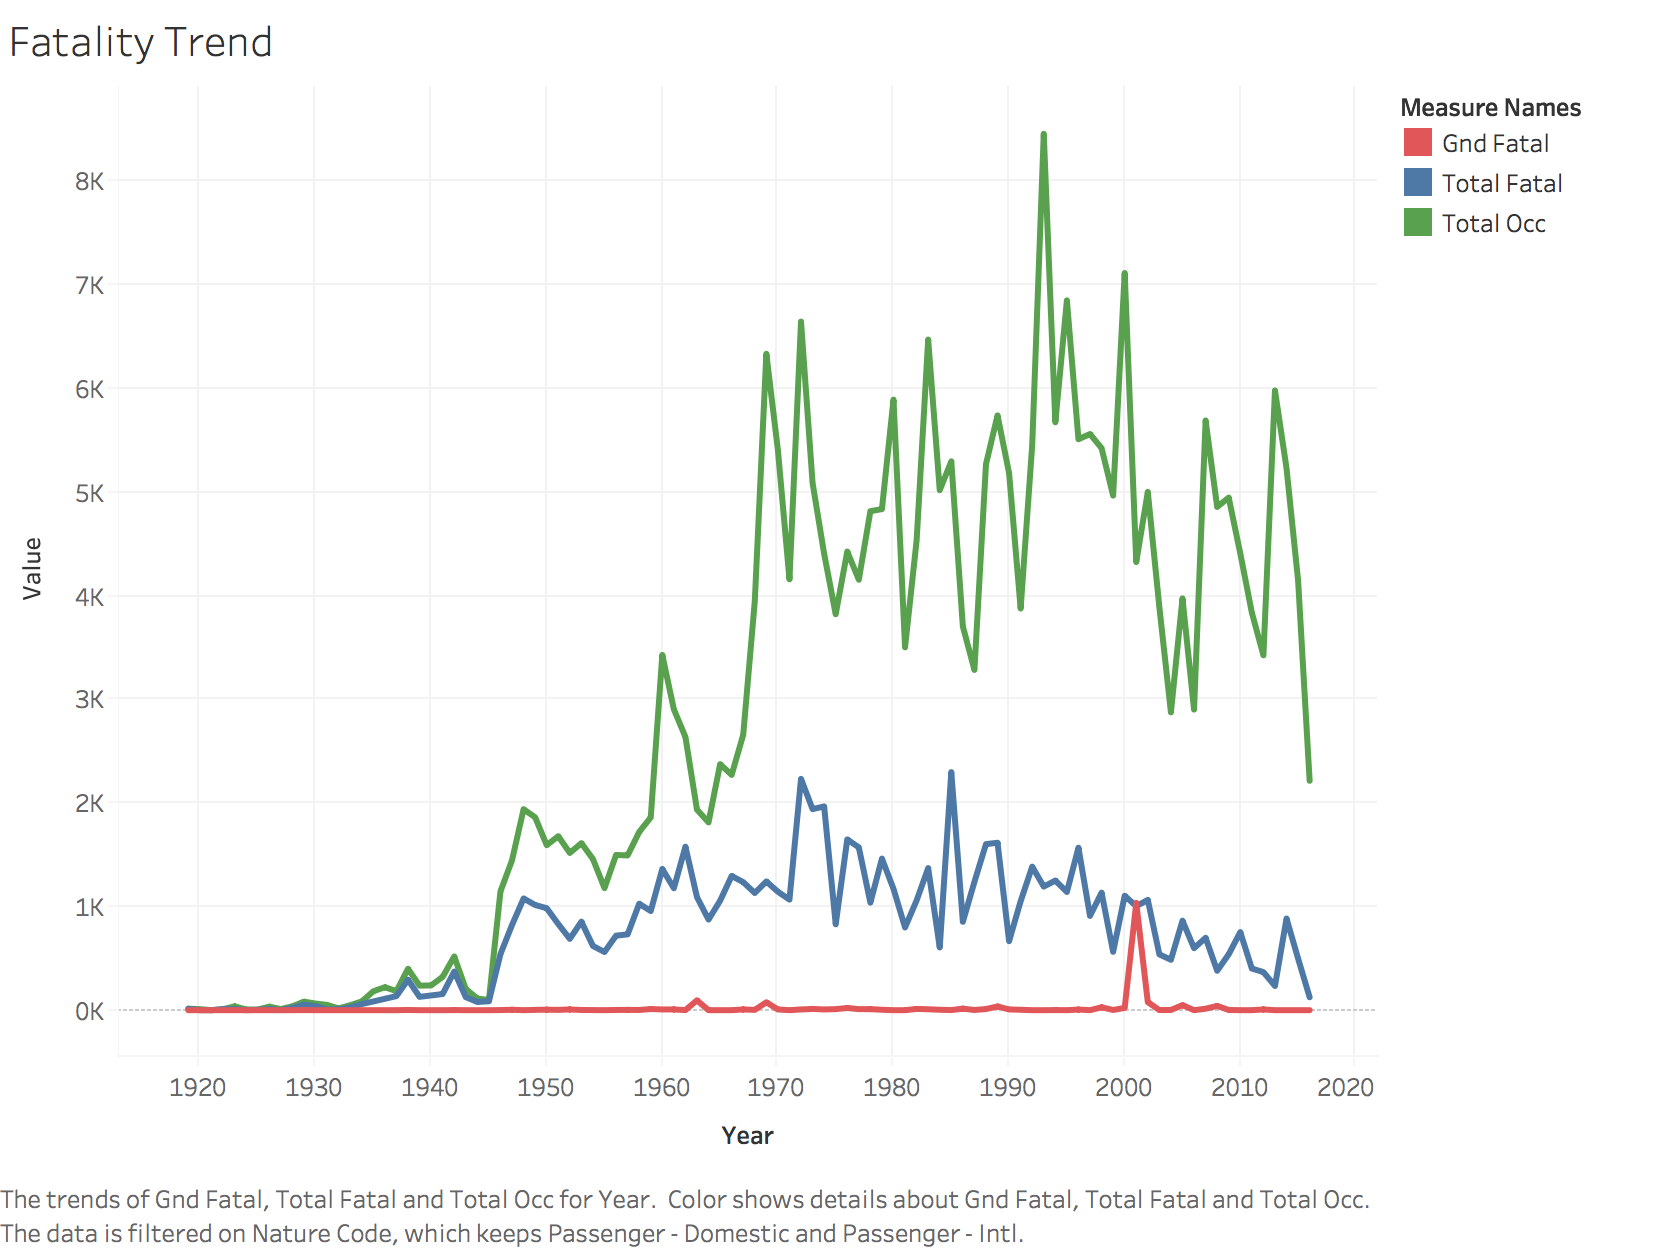
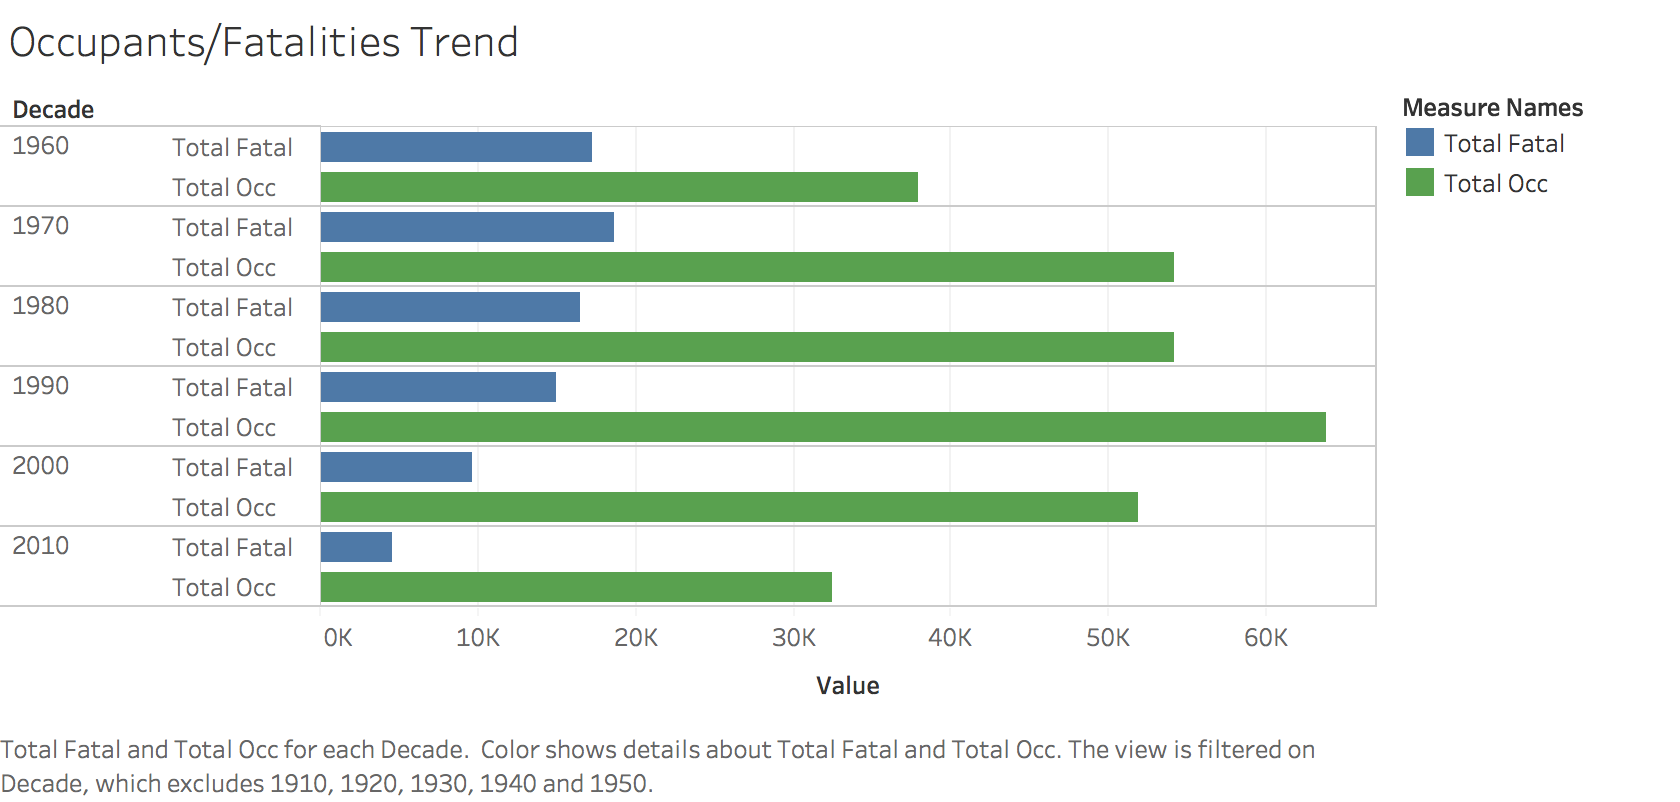
7. Data Insights/Tableau
I have used Tableau to get a better idea of the trends over the years. My Tableau workbook is int he project folder. I have added screenshots from my Tableau workbook.
The tableau dashboard published can be found here: https://public.tableau.com/profile/roshan.lulu#!/vizhome/Aviation_Accident_Analysis/TrendDashboard
8. Text Classification
I have been analysing plane accidents from the past century. One aspect of my analysis is the reasons for the accidents. My hypothesis is that the accidents are not always an isolated incident. So in my journey I am trying to identify accidents that have a similar cause.
Aviation accidents can be traced to a variety of causes, including pilot error, air traffic controller error,design and manufacturer defects, maintenance failures, sabotage, or inclement weather, Human error, Maintanence Negligence, Design and Manufacturing, Corporate Negligence and many more. I am interested in analysing the causes of the accidents.
Dataset: Given my input datasets and its features, the causes are not a feature that was easily available for analysis. Instead, the dataset has a summary/narrative of the incident as a feature. In order to answer my problem statement I am going to use Natural Language Processing techniques.
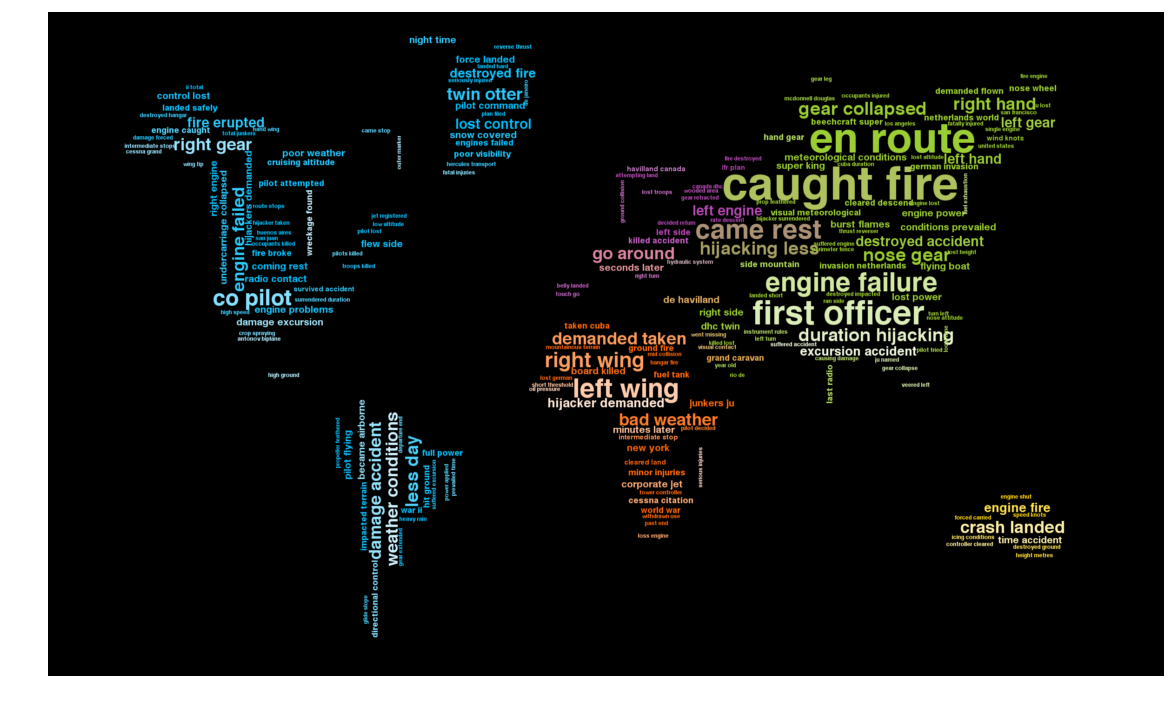
- Libraries used: Pandas and NLP were used to extract n-gram words that specify the accident reason. Plotting techniques like Wordcloud are used to plot the commonly used words to describe each category
- Approach: Use NLTK libraries to train a model that categorizes the reason of each accident base don unstructured text.
- Challenge:
- The causes are not directly available in the dataset.
- The dataset contains unstructured textual content that describes the cause of the accident.
- A model always requires an available/training set which will then be used to fit on the unseen or future data.
- Normally, if a label was already available, a train-test split method could be applied to create a model.
- Work Around: Thanks to google, I was able to read about quite a few causes. I have collected textual information that contains the key words that contribute to categorize the cause. The models will be trained with this text set. The trained model will be applied on the dataset to get the classification.
PREPROCESS TEXT
- TextBlob is a python natural language processing toolkit that provides text mining, text analysis and text processing modules. The methods used below would be helpful to use in the model
- Text preprocessing, tokenizing and filtering of stopwords are included in a high level component that is able to build a dictionary of features and transform documents to feature vectors:
TOKENIZING
- CountVectorizer supports counts of N-grams of words or consecutive characters. Once fitted, the vectorizer has built a dictionary of feature indices:
- The index value of a word in the vocabulary is linked to its frequency in the whole training corpus.
- Occurrence count is a good start but there is an issue: longer documents will have higher average count values than shorter documents, even though they might talk about the same topics.
- To avoid these potential discrepancies it suffices to divide the number of occurrences of each word in a document by the total number of words in the document: these new features are called tf for Term Frequencies.
- Another refinement on top of tf is to downscale weights for words that occur in many documents in the corpus and are therefore less informative than those that occur only in a smaller portion of the corpus.
- This downscaling is called tf–idf for “Term Frequency times Inverse Document Frequency”.
TRAINING CLASSIFIER
- Now that we have our features, we can train a classifier to try to predict the category of a post. Let’s start with a naïve Bayes classifier, which provides a nice baseline for this task. scikit-learn includes several variants of this classifier; the one most suitable for word counts is the multinomial variant:
BUILDING A PIPELINE WITH NAIVE BAYES
- We have done 3 steps for the classification usecase. It can be made shorter using a pipeline?
- In order to make the vectorizer => transformer => classifier easier to work with, scikit-learn provides a Pipeline class that behaves like a compound classifier:
BUILDING A PIPELINE WITH SVM
- Let’s see if we can do better with a linear support vector machine (SVM), which is widely regarded as one of the best text classification algorithms (although it’s also a bit slower than naïve Bayes). We can change the learner by just plugging a different classifier object into our pipeline:
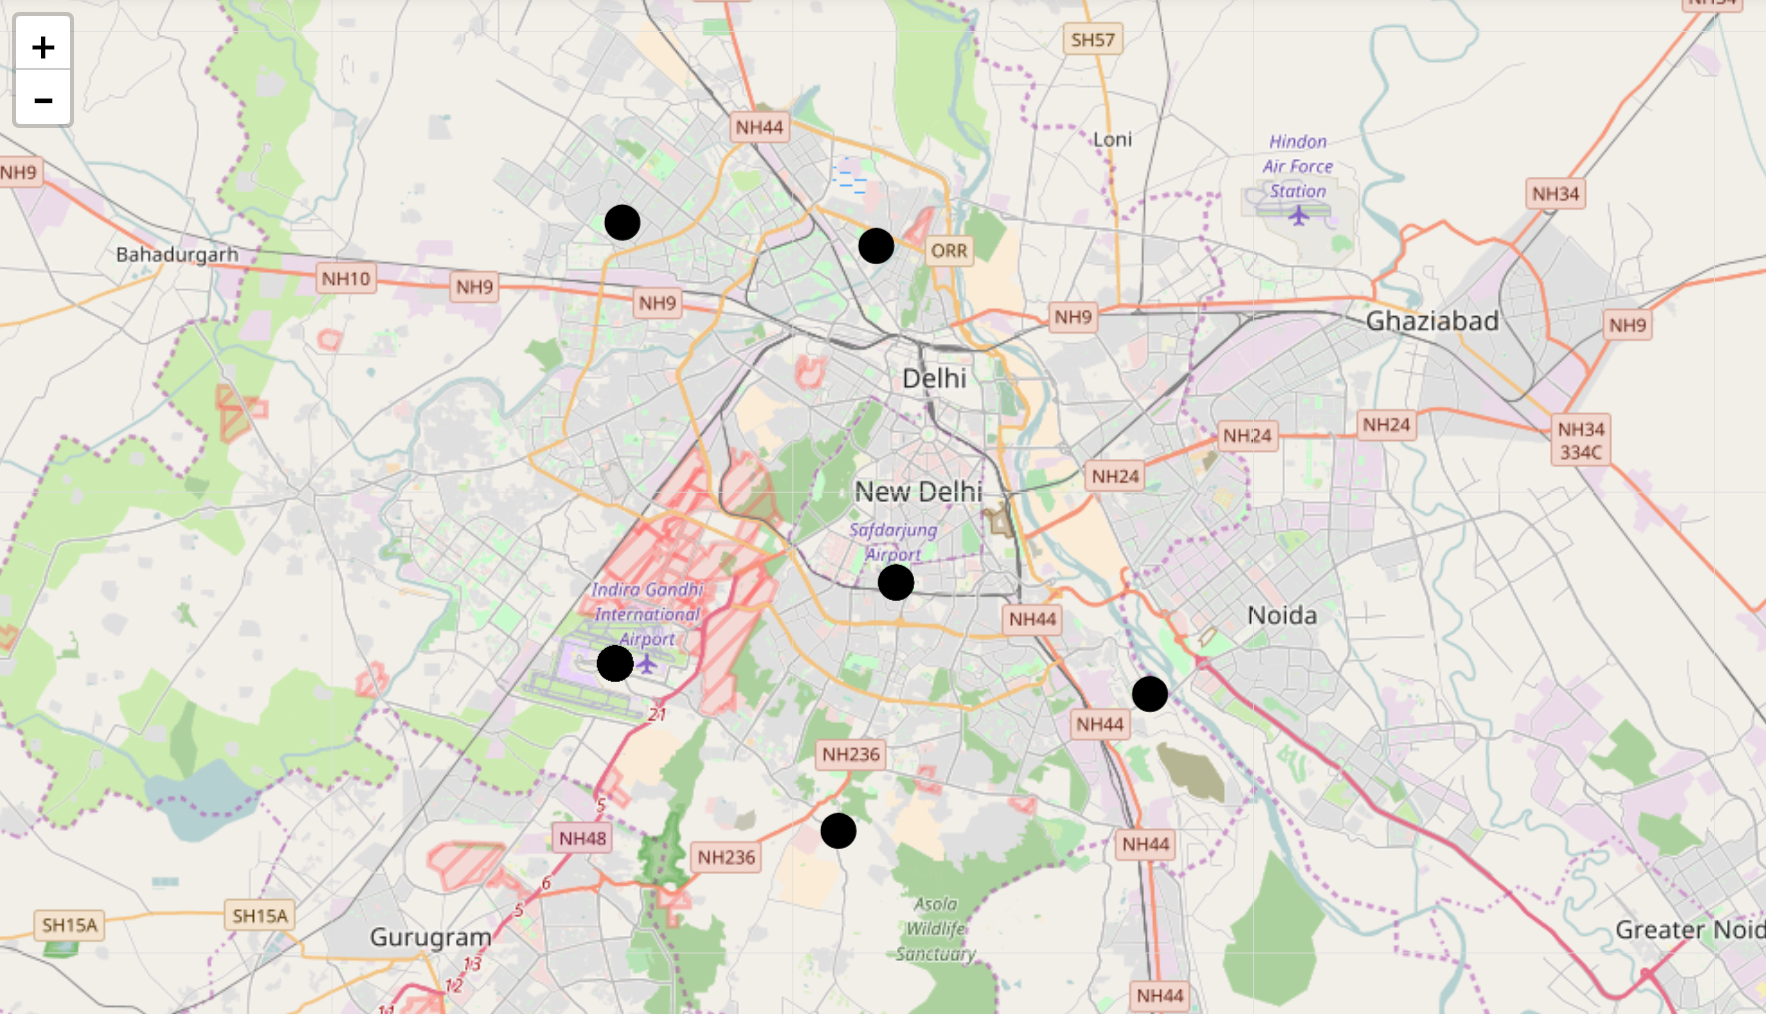
9. Locations with high density of crashes
Are aircrashes individual incidents? I am interested to check if there has been an area, where incidents have occured consistently over the years. This is a usecase for clustering, since we have datapoints wrt latitude, longitude and we are interested in closely located points that form a cluster.
To start, I will take a subset of the dataset. I tried doing clusters with the full dataset, but I realized it is much easier to start with a subset. But, to test my concept, I decided to go with an area with more developing countries and an added bonus would be if I am familiar with the location - ASIA :)
- Continent - Asia
- Nature of flights - All except Military
Clustering Technique used
- DBScan algorithm which uses haversine distance ( The haversine formula determines the great-circle distance between two points on a sphere given their longitudes and latitudes)
Clustering parameters
- Distance between Accident locations - 1 km
- Convert the distance into radians before setting the eps value for DBScan clustering.
- Minimum number of incidents to have occured in that area - 20
What is the trend over the years at this location?
- Accidents were at its peak during thr 1980s and 1990s.
- Indian Airlines, AirIndia flights were involved 10 out of the 20 times
- The aircraft manufacturer with most no of accidents int his area is Boeing/Douglas.
- The engine manfacturer for both Being and Douglas flights were Pratt and Whitney
- Most of the incidents were at Landing, Approach or Taxi phase. Which means, it is near the airport. The airtraffic managament would be a factor to probe into. I further checked the incidents near this region. The runway seems to be a common word in these incidents. For further studies, the runway charachteristics like length, surface could be good features in the dataset
Any interesting facts?
- 8 March 1994 - Collision between Sahara Indian Airlines and Ilyushin 86
- A Sahara India Airlines Boeing 737, VT-SIA, was engaged in a training flight with an instructor and 3 trainee pilots. Five circuits and landings were completed uneventfully. During the sixth touch-and-go exercise, after the take off from runway 28, the aircraft had climbed to 400-500 feet when it banked left and crashed at the International Terminal Apron. The wreckage of aircraft hit an Aeroflot Ilyushin 86 aircraft parked on Bay No. 45 as a result of which it also caught fire. Two Aeroflot employees, a Russian ground engineer and an airport worker were killed inside the Il-86. One employee of an airport oil company was killed on the tarmac.
- The Ilyushin 86, RA-86119, had made an unscheduled diversion to Delhi due to technical problems. The airplane had been repaired and fully fuelled (52 tons).
- 28 January 1983 - Collision between AirIndia and Indian Airlines flight -
-
Air-India Flight 306, a Boeing 747-200B registered VT-EFO, landed at Delhi Airport at 20:10 hrs and was cleared for parking on bay No 17 via taxiway C (behind bay No 12). Earlier, Indian Airlines Airbus A300 VT-EFV had landed and was parked at bay No 12 . To rectify a radar snag, the Airbus was positioned facing west, opposite to its normal parking position. After rectification, while the Airbus was being manoeuvred to its initial position, it got stuck 90 ft behind the marked parking position thereby forming an obstruction to aircraft taxying on taxiway C. The Boeing 747 aircraft on its way to bay No 17 hit the tail portion of the stationary Airbus. Both aircraft sustained substantial damage.
-
The cause of collision was failure on the part of the Indian Airlines to inform ATC and IAAI when their aircraft was forming an obstruction to the aircraft taxying on C taxiway and failure of the pilot-in-command of Air India Boeing 747 to exercise caution during taxying even when signaled to deviate from centreline of C taxiway. The contributory factor was lack of co-ordination between and within the concerned agencies which are required to ensure safe movement of the aircraft at the airport.
-
Considering the fact that this is a sparse dataset, 2 similar kinds of incidents at the same location is something that we should be concerned about. Specially, since both were due to negligence of air traffic management.
I was a curious about the current performance in this area. Further I want to check the incidents in that area in the last 10 years. I tried reading up about the Airport and was glad I found this piece of information!
10. Results and Recommendation
Recommendation for Aviation safety authorities:
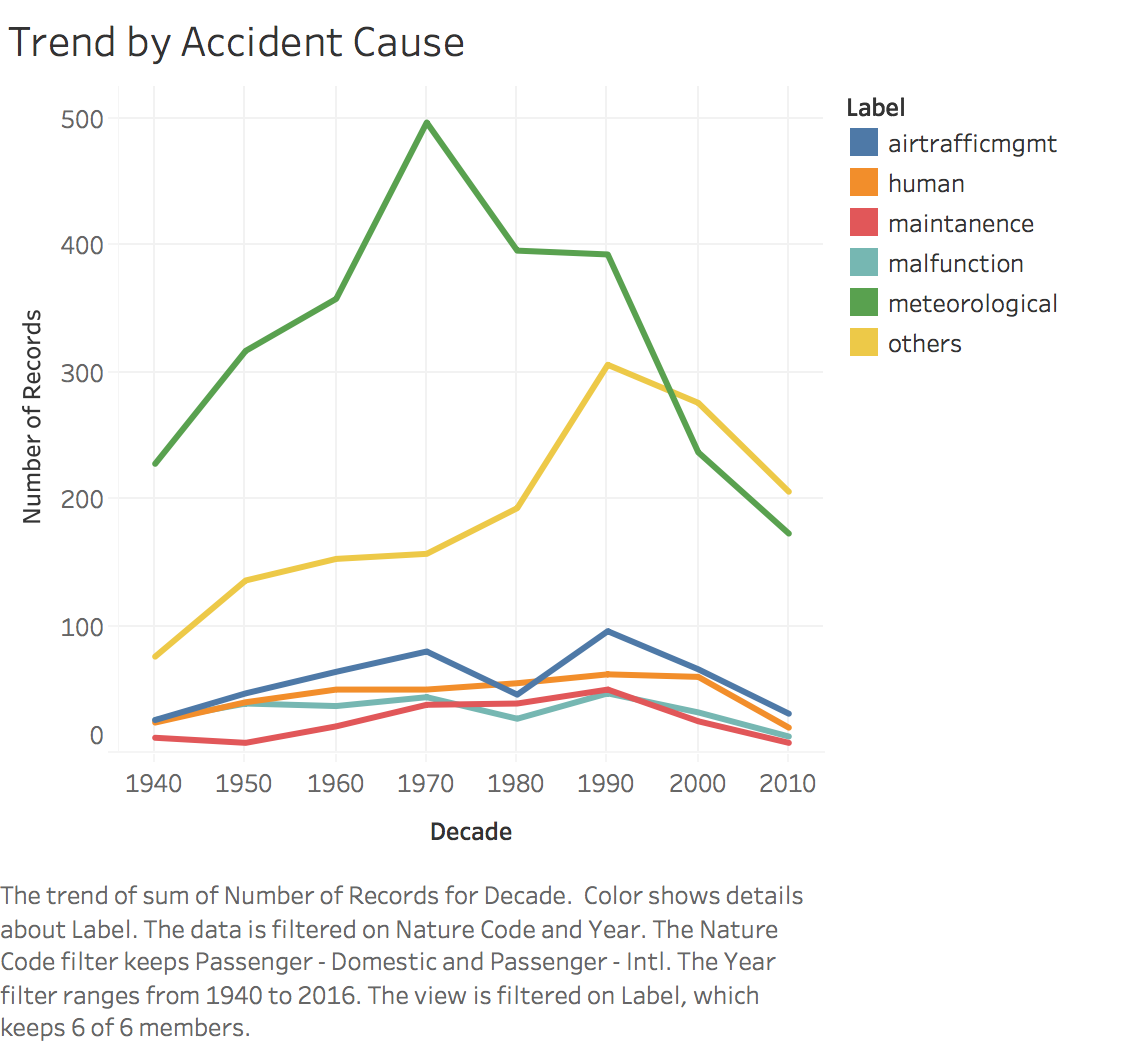
- When analysing the cause of accidents it is observed that there have been a lot of meteorological errors and pilot errors.
- Trend over the years for various errors have decreased, but there is still room for improvement.
- When I started analysing the density of crashes > 20 within a 1 km distance, the clustering results provided were quite good in boiling down to a location that did have history of more than one flight collisions. When checking the causes it was mainly the air traffic management that was a major cause for the accidents.
- The model can be used to zero down on other locations to find root causes of issues that occur in certain areas. This was just one example. By changing the parameters of my algorithm, i believe it would be possible to find more accident prone areas. Accidents are not always an isolated incident. With proper study about past accidents, avoiding atleast one incident in the future would be a success metric.
- While researching on the Delhi area, I realized that another collission incident was successfulyl avoided. This is good enough proof about the steps that have to be taken to improve the traffic management at the airport.
11. Future Steps
Analysing the past crashes with the fatal accidents was done in this project. During the phase of the project I realised the enormous amounts of research that happens in this area to increase safety.
Aviation accidents are objectively highly unlikely. But there are definite patterns we can learn with historical data and use to avoid repeating the same mistakes.
One of the major studies that have been occuring in this area is the Natural language processing of the cockpit conversations, communication with the air stations, transcripts from black box etc. With the increase in technology namely natural language processing and Machine learning, the analysis of these kind of unstructured information is becoming easier.
The focus of this project was based on a database involving accident details. There were quite a few null values in this dataset that had to be imputed. Lesser null values would mean better analysis.
The focus of the dataset was parameters that were recorded whent he incident occured rather than focusing ont he features that caused the accident like weather condition, time into the flight that accident occurred etc. In order to improve the models, more data would be required.
Aviation industry is definitely getting better over the years. Considering the fact that it is also becoming a common mode of transport unlike the luxury it used to be, the safety standards can never be enough for the improvements to stop.
News from 2016 - I was glad to read this up! This shows that the air traffic management has become better when compared to few decades ago.
http://timesofindia.indiatimes.com/india/indigo-and-spicejet-flights-avert-collision-at-delhi-airport/articleshow/56195815.cms
- A major mishap was averted at Indira Gandhi International Airport when an Indigo flight 6E 769 and a Spice Jet flight SG 123 came face-to-face on the runway. However, no damage occurred as it was promptly flagged. The Spice Jet flight was following ATC instructions. While taxing, the Spice Jet crew observed another aircraft in the opposite direction.