Predictive Analysis of Housing Data
The aim of this project is to estimate the Sale Price of residential properties in 2010, with the renovatable and non-renovatable features of the house as predictors. A pre-2010 housing dataset is provided for training the model. How can Datascience(descriptive and predictive analytics) be used to determine the best properties to buy and re-sell.
Project Outline
- Problem Statement
- Predict Sale price and find feature that are most effective
- Find features that predict an Abnormal Sale condition
- Conclusion
Problem Statement
- Predict Sale price and find feature that are most effective
- Develop an algorithm to reliably estimate the value of residential houses based on fixed characteristics.
- Identify characteristics of houses that the company can cost-effectively change/renovate with their construction team.
- What property characteristics predict an “abnormal” sale?
Predict Sale price and find feature that are most effective
EDA
- Initial look at the dataset
- Shape 1460, 81. The 81 features are described here
- The following categories of predictors are given in the dataset.
Fixed characteristics, changeable characteristics, Property characteristics, External surrounding characteristics Material used in the property, Utilities in property, Condition of property feture, Quality factor of any property feature The Area of any property feature, No of rooms in the property, Basement characteristics of property, Garage characteristics of property, Any year related to property buy/sell/renovate, Porch related characteristics of the house, Pool related characteristics of the house, Miscellaneous characteristics of the house, Price related details, Continuous , Categorical(make dummies) - There are 10 non-residential properties. Drop it.
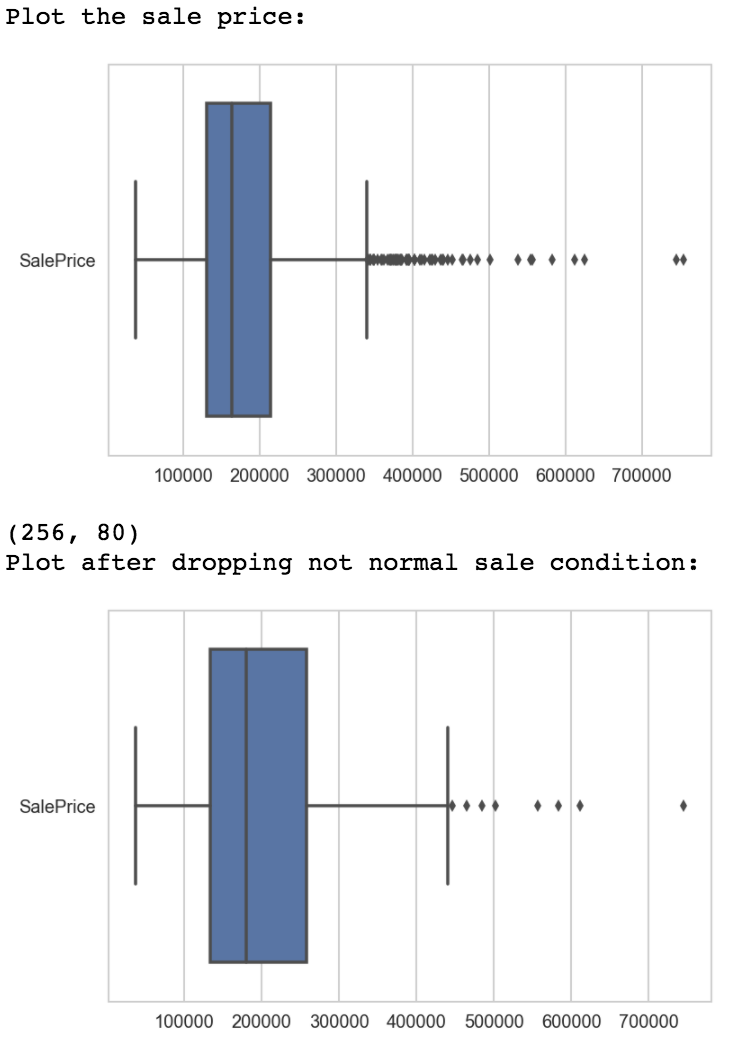
- Take a look at the target Sale price. Best way would be to plot a distribution. This also helps in checking outliers.
- Examined the fixed characteristics of the house and after required feature engineering selected predictors and plotted a heatmap before modelling.
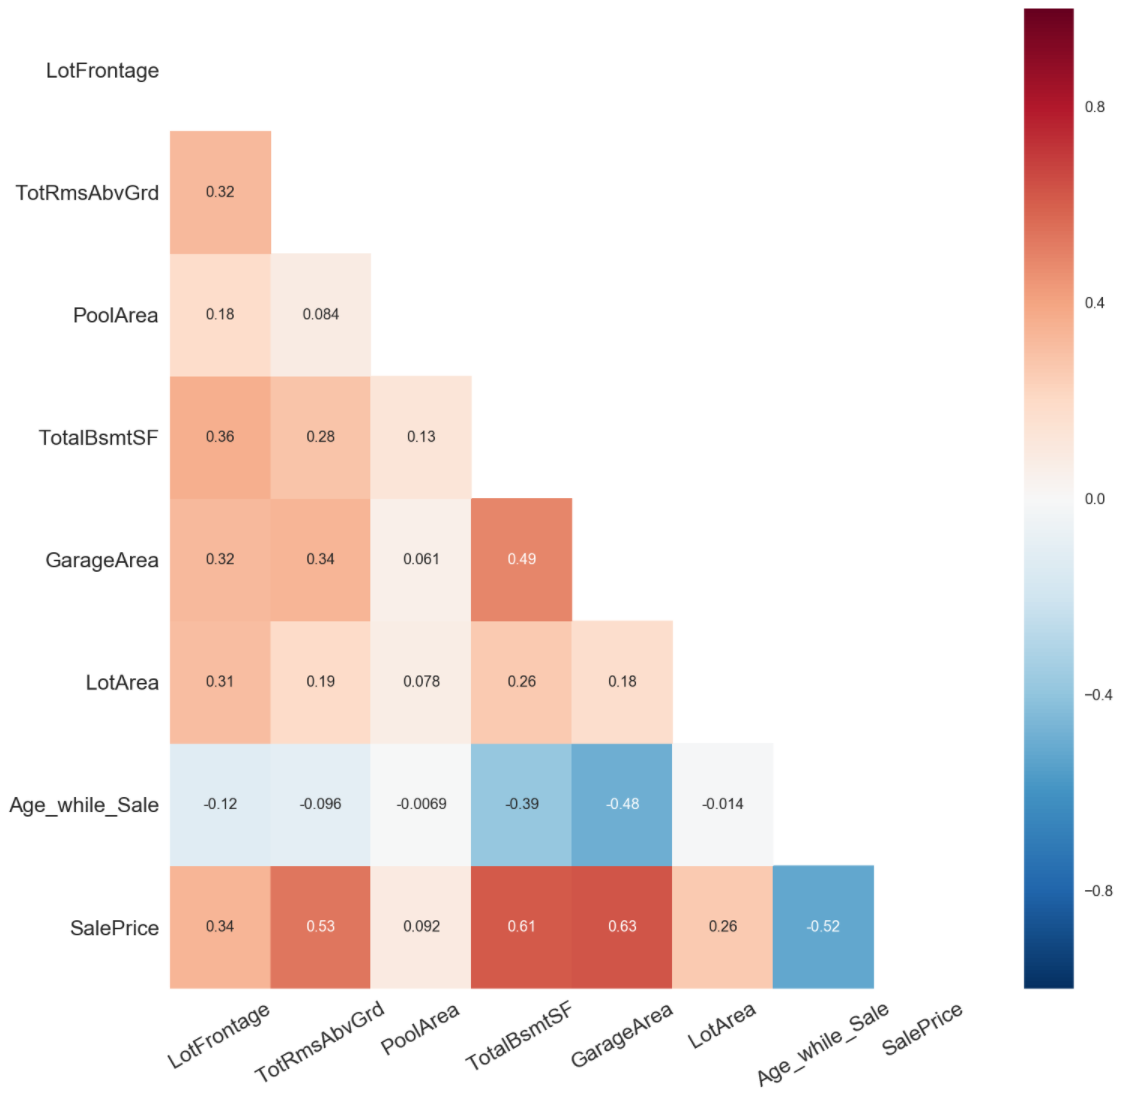
Predictors selected
Total number of rooms, total basement square feet
GarageArea, Age of the house at the time of sale
Data Modelling
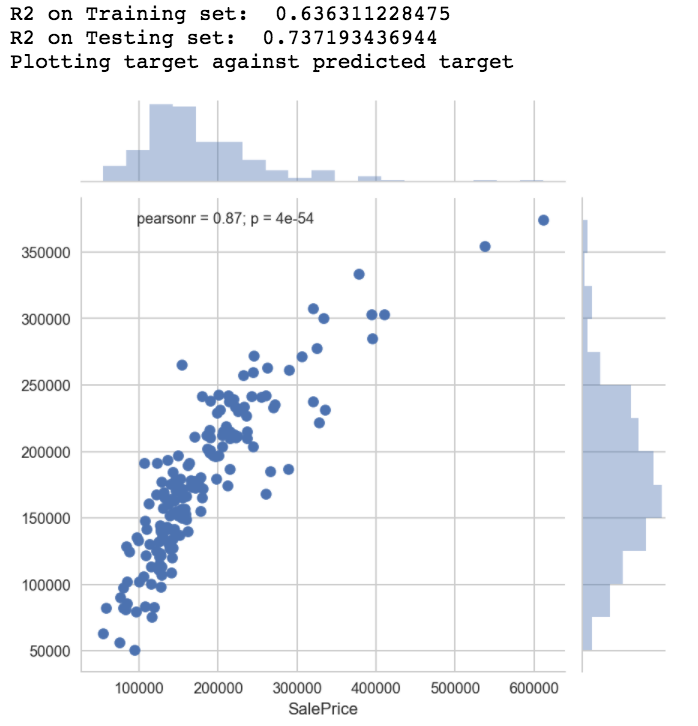
A.Linear regression model results with selected predictors
- The model was validated using Cross validation(10 fold) and Train/Test.
- I tried different folds from 5 to 20 but there was not much of a variation.
B.Linear regression model results after Regularization
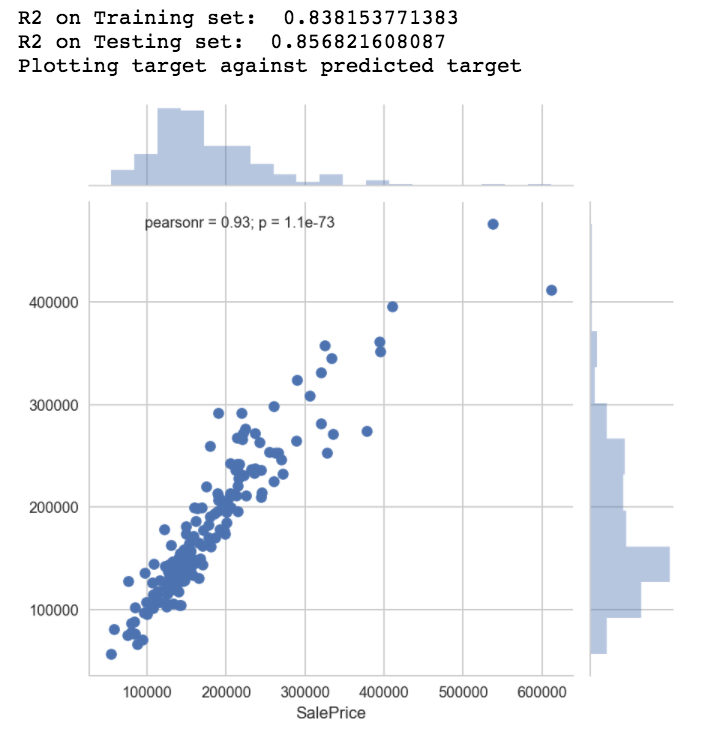
- Lasso regularization provided better results than Ridge regularization.
C.Linear Regression model with renovatable and non-renovatable features of the house as predictors
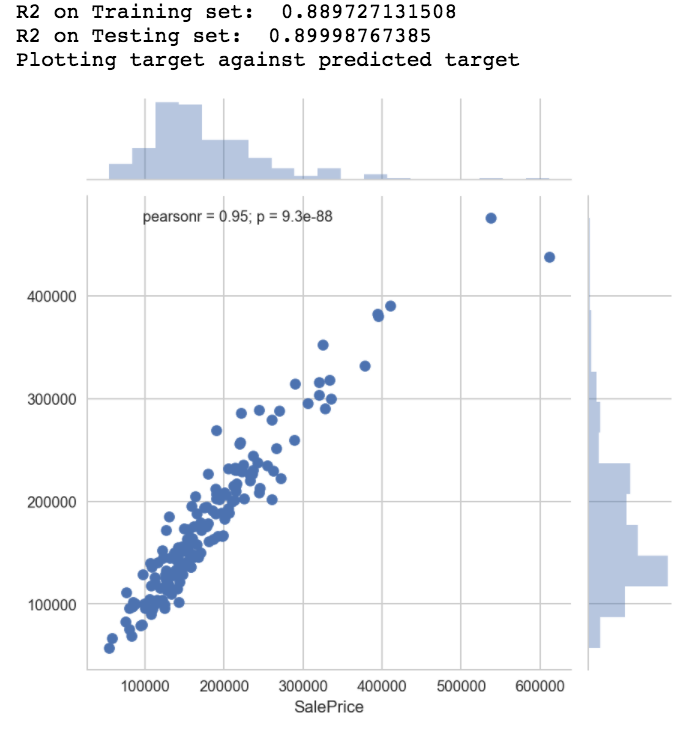
- The R2 value is high and could be a result of overfitting
- Evaluating the residual error is also important to evaluate the goodness-of-fit of a model.
- The residual error is high, hence the variance explained by the renovatable features may not be good predictors for the model.
- The second model suggest that renovating the houses may not provide any profit, instead it may even result in a net loss.
Find features that predict an Abnormal Sale condition
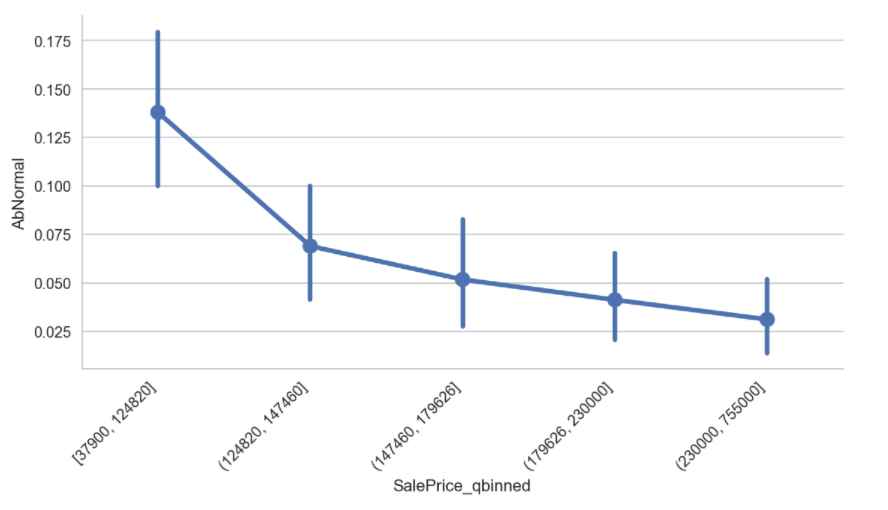
- Lower Sale price contributed to more abnormal sale conditions
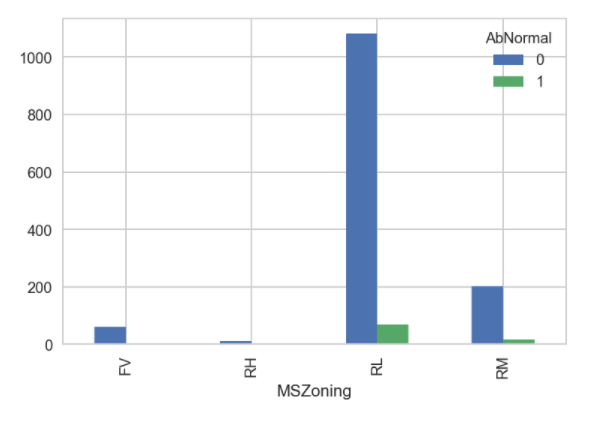
- Residential Low density zones have more sales overall and the most abnormal sales. May not be a geat predictor though.
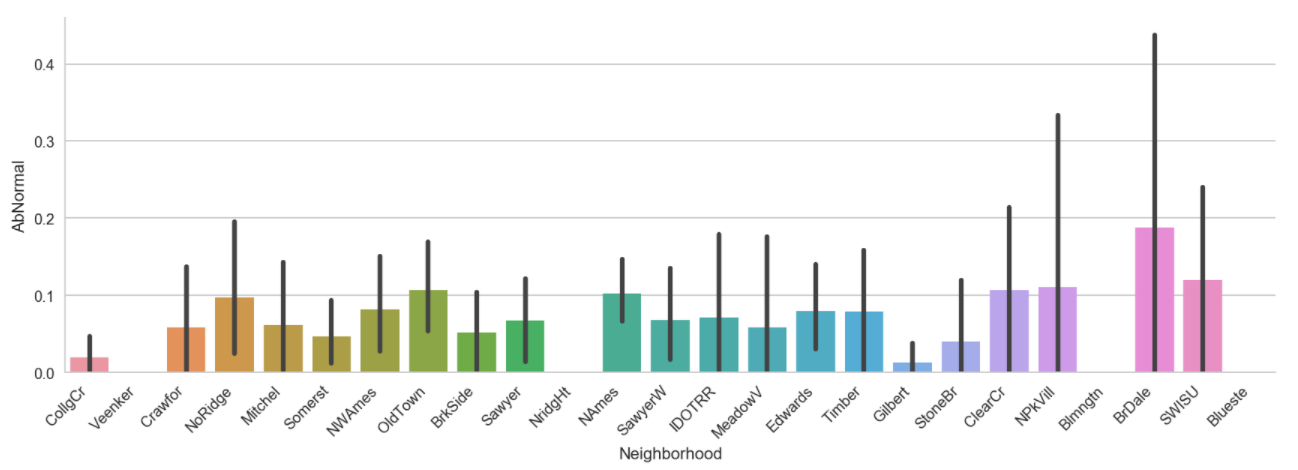
- Which suburb has the most number of abnormal sales - Briardale
Conclusion
- The best renovatable predictors selected after EDA - Total number of rooms, total basement square feet and GarageArea.
- Predictor added after Feature engineering - Age of the house at the time of sale
- These features explain 73% of the variance with a Linear regression model.
- Renovating the houses may not provide any profit, instead it may even result in a net loss.
- More abnormal sales are found in Briardale suburb and houses with lower sale prices are higher contributors.
Written on April 29, 2017